
What’s new: Insights made easier with Verbatim Finder, Relative Flow, Instant Splits, and more
In the realm of text analytics, keeping pace with innovation is vital. That’s why Relative Insight is committed to continuously deliver the best-in-class solutions to redefine the way you explore, segment, and manage your data.
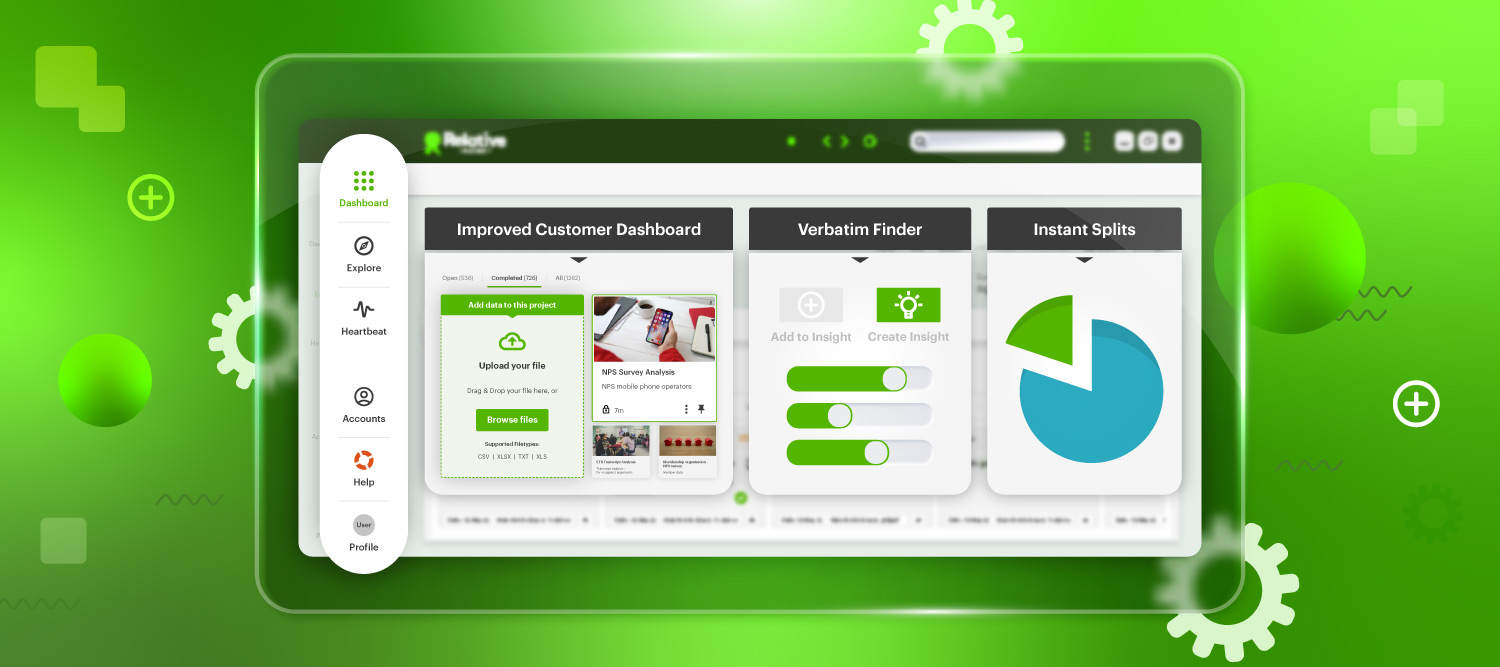
Therefore, we’re thrilled to introduce our latest platform additions: Verbatim Finder, Improved Customer Dashboard, Relative Flow and Instant Splits. Relative helps you arrive at data-driven decisions quickly, unlocking insights that propel your business forward.
Let’s dive deeper into what’s included in these new additions.
Verbatim Finder: Instant access to quotes and keywords
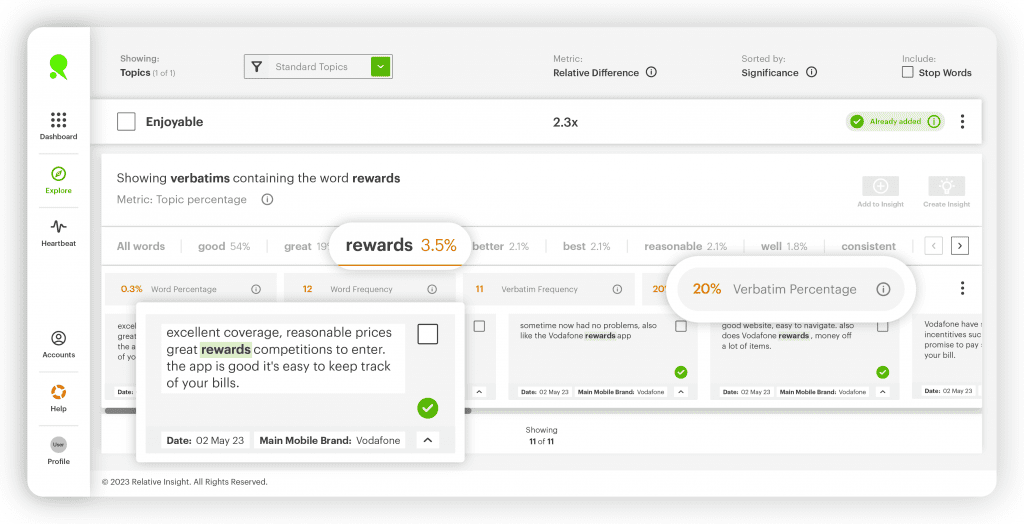
The Verbatim Finder enables you to easily delve into each topic within your data. It offers immediate access to the most relevant information to quickly identify trends and patterns.
In the new Explore layout, you can easily view the words and verbatims associated with each topic. The items are now arranged across the top, instead of being listed as words down the page. Additionally, your metrics will be on display, allowing you to judge the significance of each word in the topic based on its percentage or frequency.
With Verbatim Finder, you can quickly find relevant quotes and add multiple verbatims to create robust insights and build compelling narratives. To create an insight card or add to an existing one, simply select your items and click “Create insight” or “Add to insight”. Once added, a tick box will indicate where the items can be located.
Data management in an improved Customer Dashboard
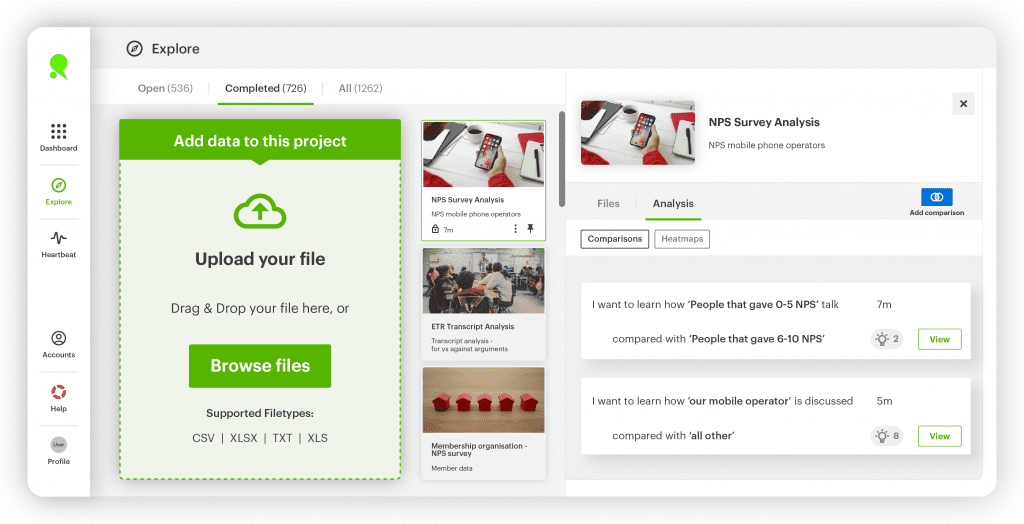
In the Customer Dashboard’s updated interface, a new side panel will help you manage and explore your data from one centralized location with ease.
In the new view, you can easily switch between various projects and access all your items. Your data assets are displayed on the split screen as default. You can upload more data to your selected project by clicking “Browse files”. Here, you can also create Custom Themes or upload them in bulk.
In the Analysis tab, you’ll find existing Comparisons or Heatmaps. If you prefer to view the full screen, click “Dashboard” or X.
Streamline your analysis with Relative Flow
Our integration suite, Relative Flow, simplifies the reporting process. With automated data upload and management, the platform takes care of data processing and analysis, ensuring you get the insights you need in no time.
Its easy-to-use automated reporting features enable you to track critical metrics, like your CSAT or NPS score, effortlessly.
In addition to its streamlined data management capabilities, Relative Flow offers automated visualizations that bring your data to life for board-level reporting.
For Tableau and Power BI users, great news: automation is coming your way. Relative Flow integrates with these tools, allowing you to enhance your data analysis capabilities even further.
Advanced customization with a stop words filter
The latest update also includes a new stop words filter. This allows you to refine your analysis by excluding or including common words such as “the”, “if” and “or”, as well as “stop topics” from your analysis.
Along with previous updates, such as customizable metrics, overall metrics and sorting based on preference, this enables the most advanced customization of your insights yet.
Heartbeat performance improvements
Heartbeat performance improvements enable faster analysis capabilities for processing more data and gaining a deeper understanding of your audiences. On average, Heartbeat can now process your data 7x faster.
Coming soon! Instant Splits in Data Discovery
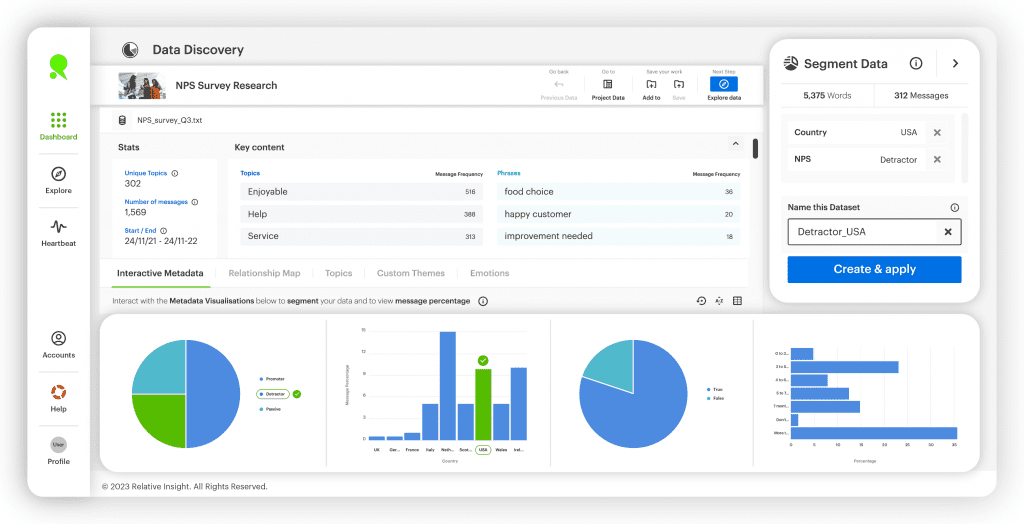
Our brand-new Instant Splits feature allows you to effortlessly create segments from your data. Using metadata charts in Data Discovery, you can create your target audience by selecting multiple characteristics.
For instance, if you want to analyze data from your female promoters, click on the bar chart representing NPS 6-10, and then select the piece of the chart that shows women. By choosing data from your metadata charts in Data Discovery, you can quickly generate splits that grant a better understanding of your audiences in no time.
At Relative Insight, your satisfaction is our top priority — and your feedback is invaluable to achieve this. If you have improved your customer feedback analysis with Relative, please share your thoughts by leaving a G2 review.