
Data Discovery: Instantly visualize your qualitative and quantitative data
The power of visualization at your fingertips
Looking to streamline your data analysis? Meet Data Discovery — a powerful visualization tool that transforms the way you uncover insights. Instantly visualize complex data to reveal patterns, trends and relationships that drive understanding.
Accelerate time-to-insight
Traditional data analysis methods often demand hours to yield meaningful results. With Data Discovery, value is delivered instantly. Simply upload your data and start generating actionable insights for informed decision-making.
Unlock instant value
Data Discovery offers a wide range of tailored visualizations that provide immediate clarity, guiding you toward valuable insights. At a glance, grasp key trends and identify significant topics to investigate further.
Drive business success
Whether you’re presenting to the board, collaborating with team members or engaging with clients, Data Discovery equips you with stunning visualizations that really tell the story behind your data.
Elevate your stakeholder communication with powerful visualizations
Data Discovery FAQs
What is Data Discovery and how does it transform data analysis?
Data Discovery leverages the power of data visualization to unlock hidden relationships and patterns in your data. By transforming data into appealing representations, it provides a deeper understanding of complex information. This tool streamlines the data analysis process, empowering you to make data-driven decisions quicker.
How does Data Discovery simplify the data import process?
Data Discovery offers Smart Uploads and drag-and-drop import features. Our algorithms analyze and streamline the process, allowing you to import your data in just a few simple steps.
What are the visualizations provided by Data Discovery?
Data Discovery offers four key visualizations:
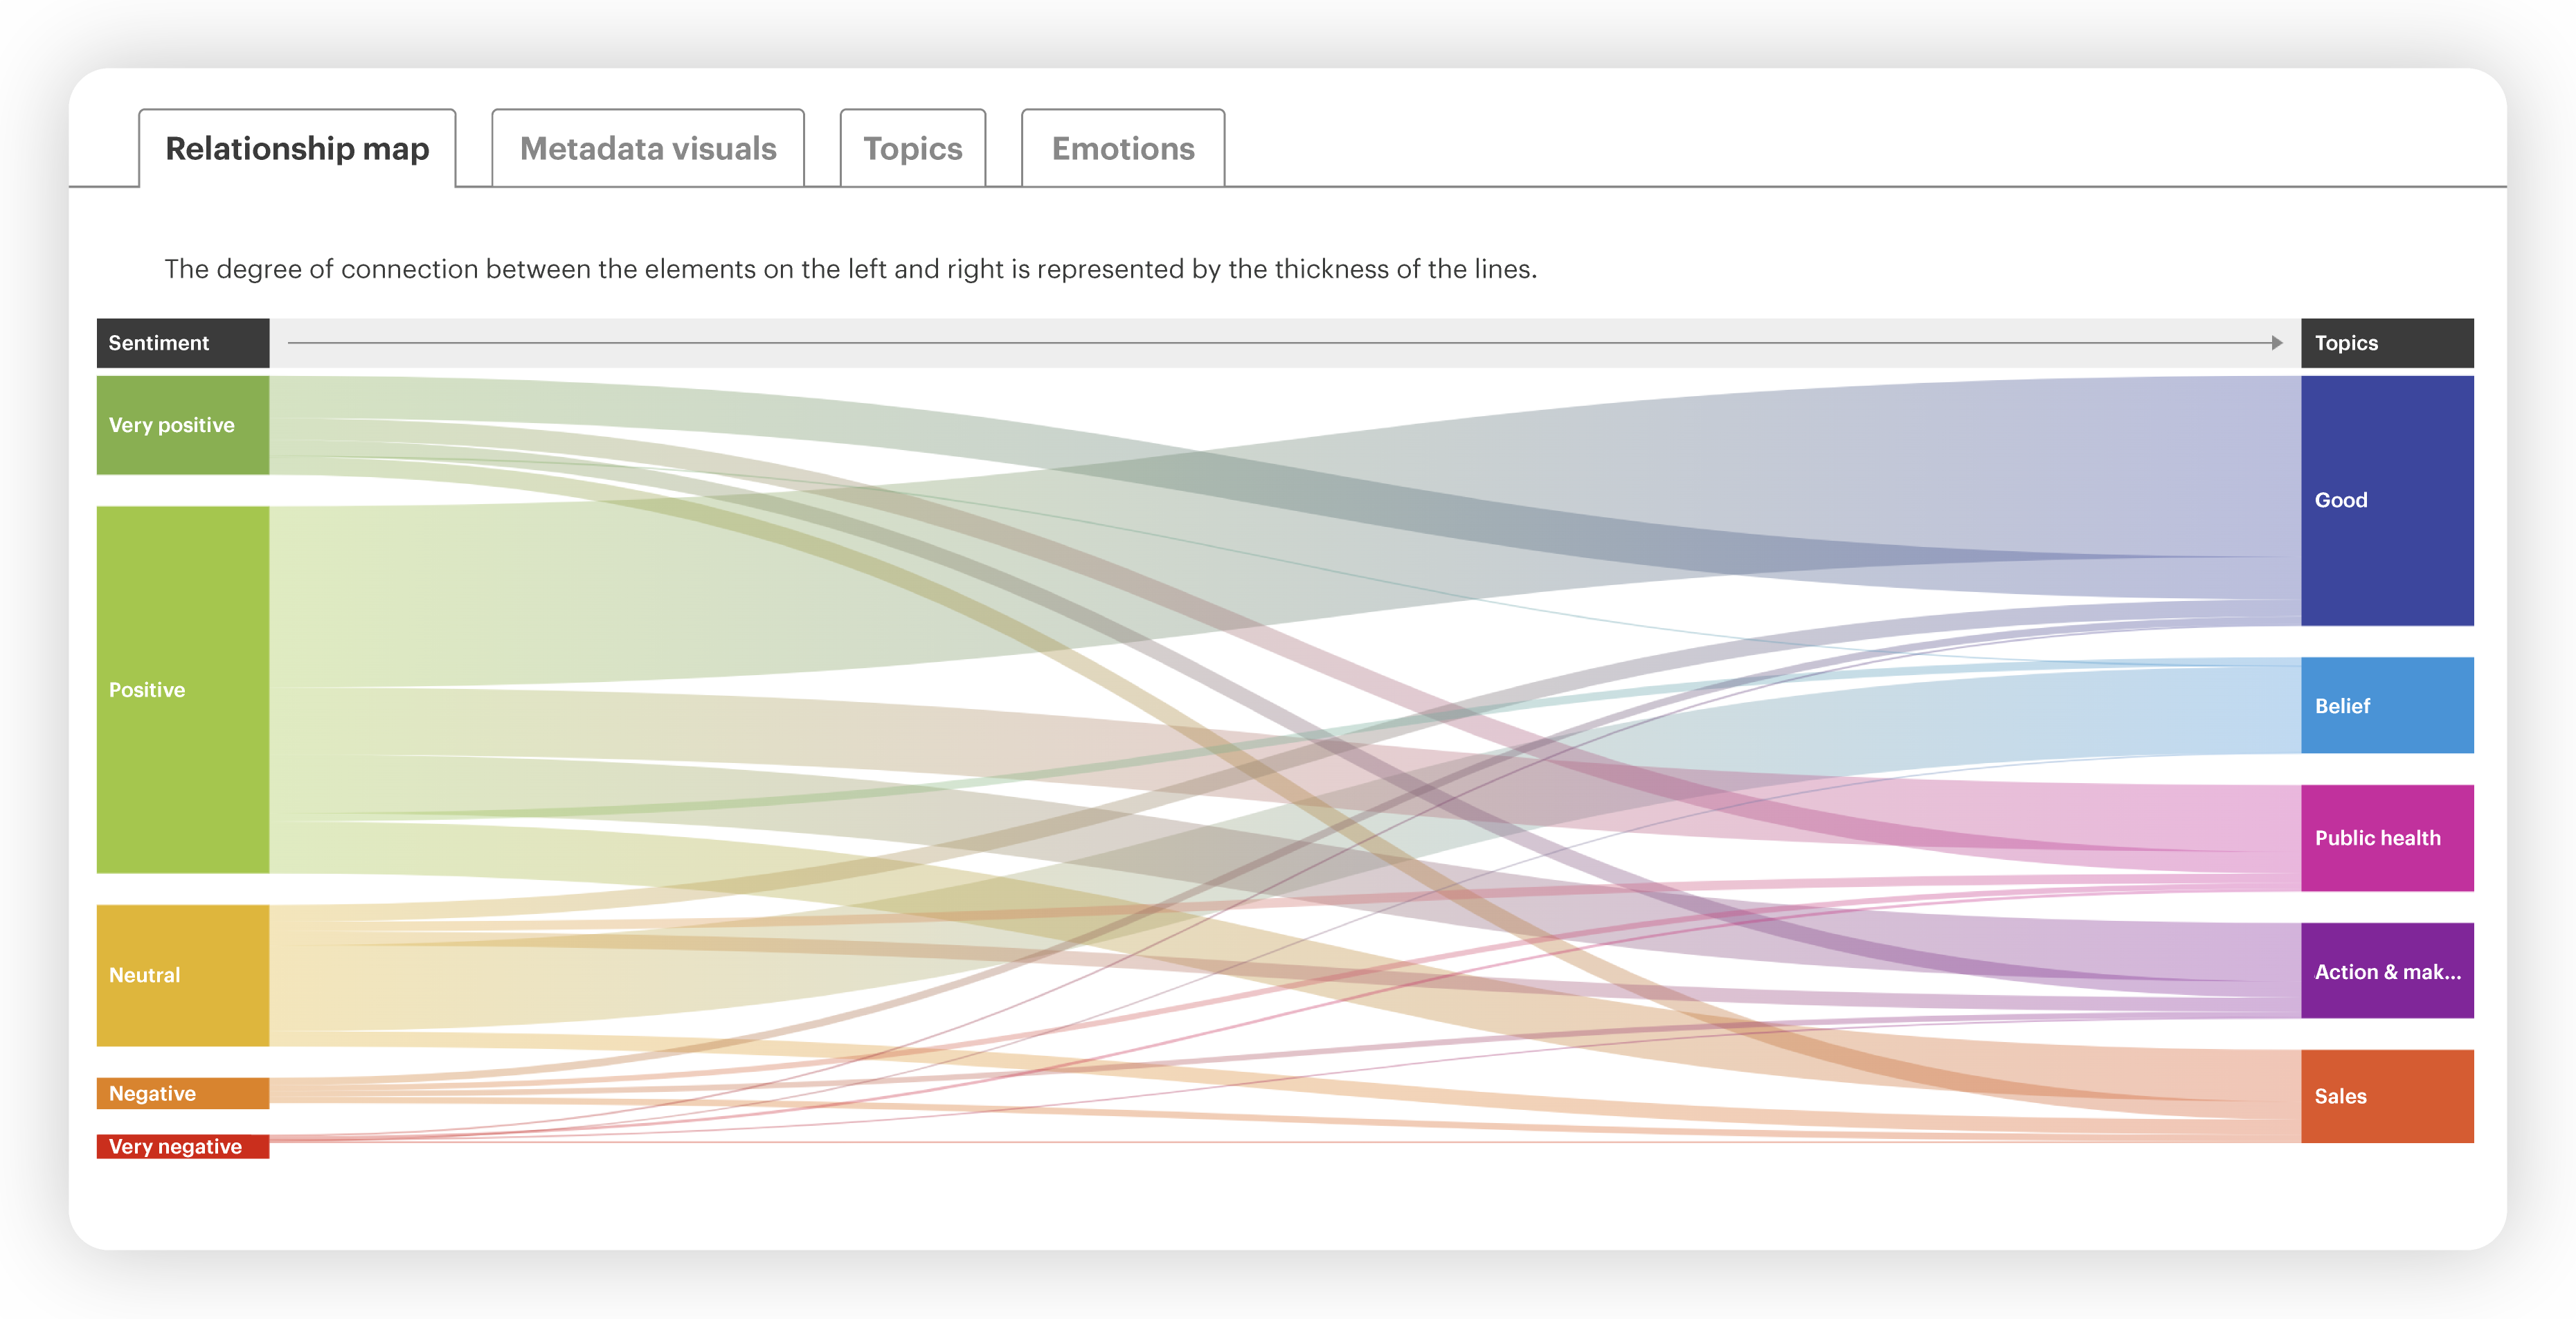
- Relationship map: A Sankey diagram that illustrates the flow and connection between sentiment and topics.
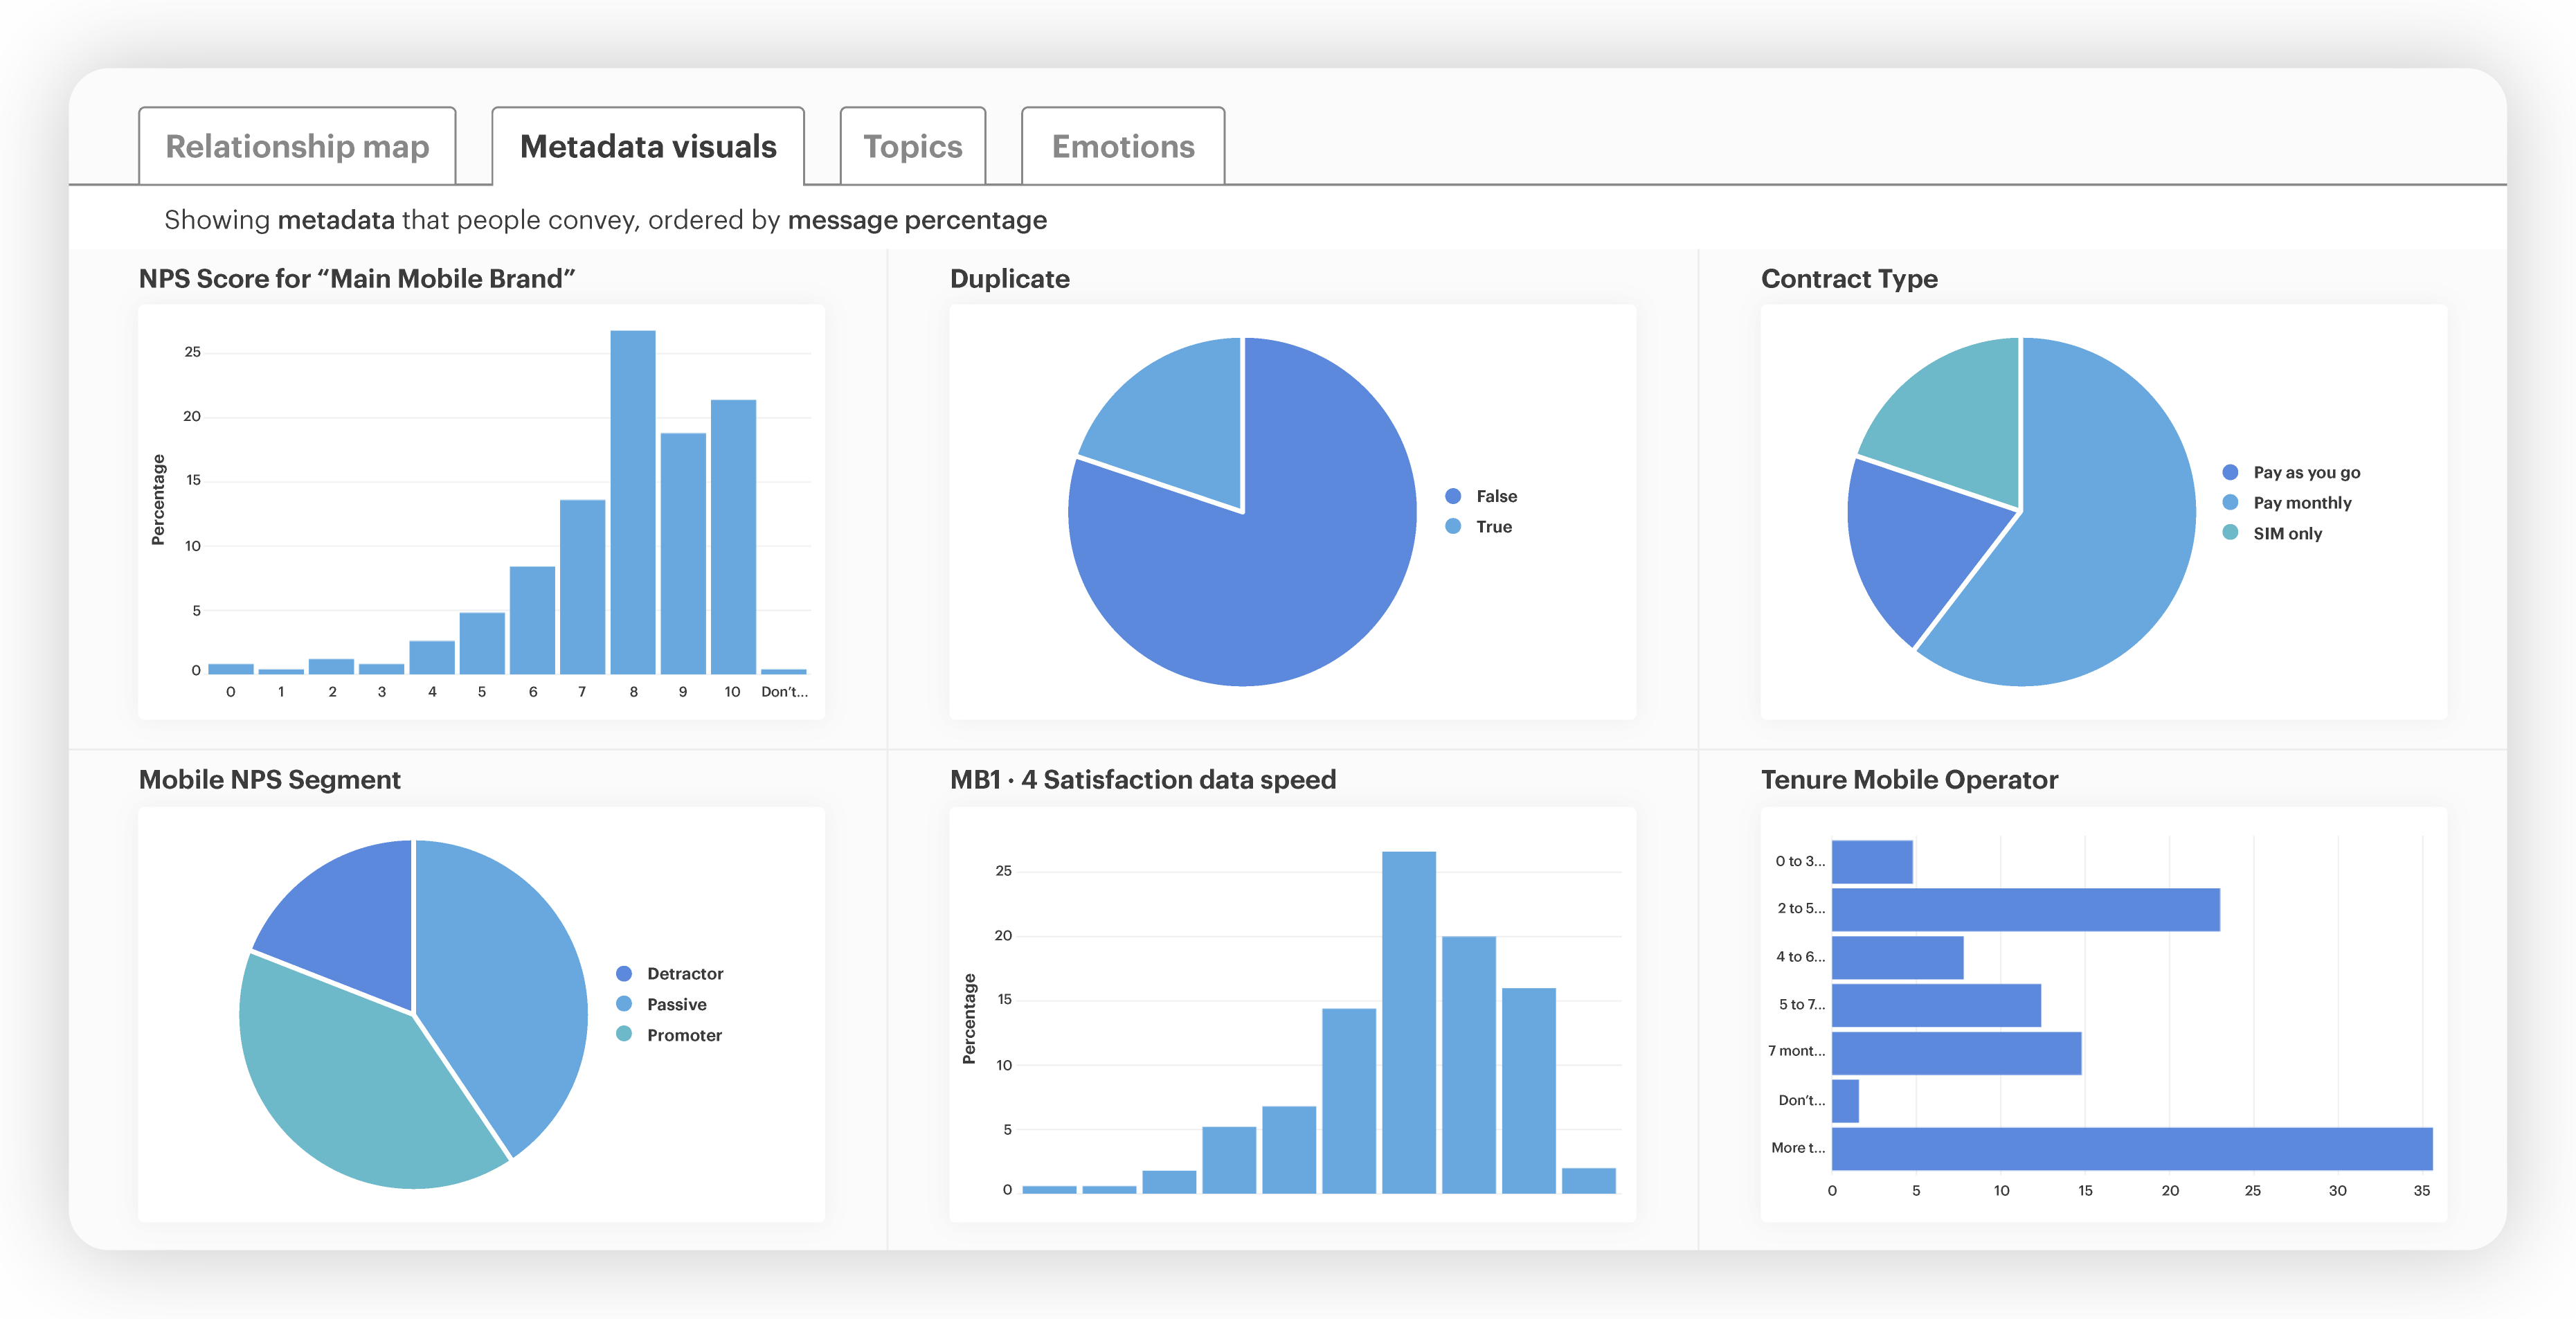
- Metadata visuals: Tailored charts and diagrams that represent various data points in your dataset, such as gender, age, location, and more.
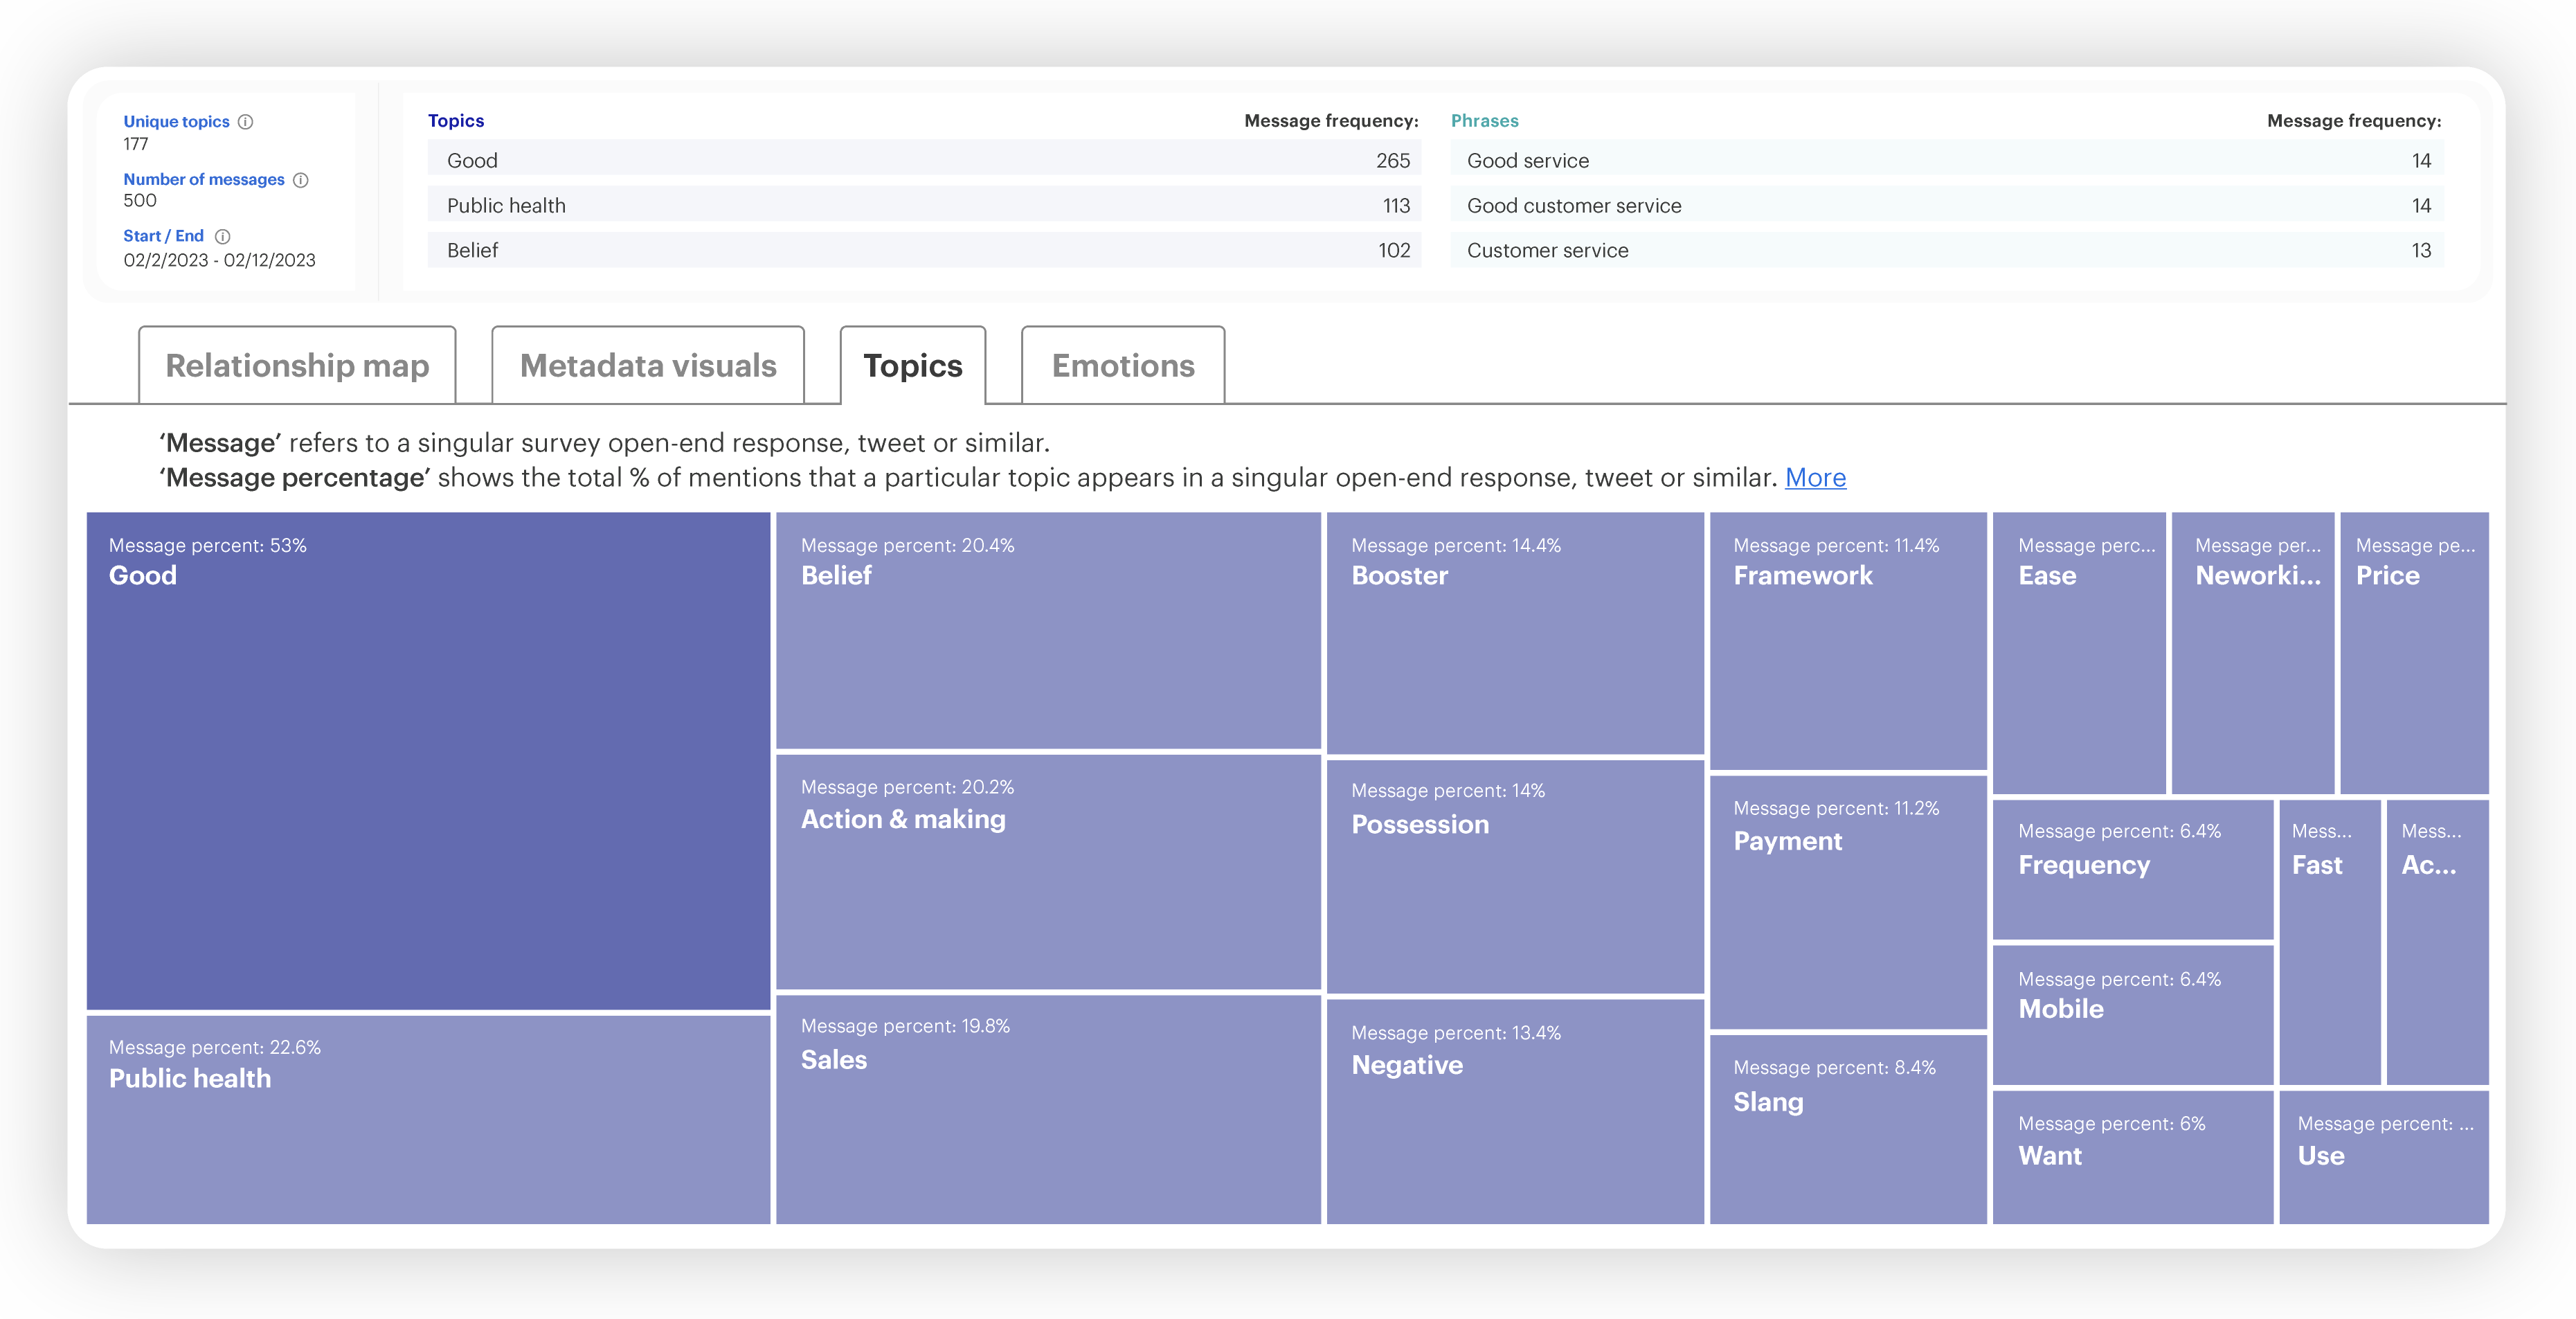
- Topics treemap: An intuitive treemap visualization that displays main topics based on their message frequency.
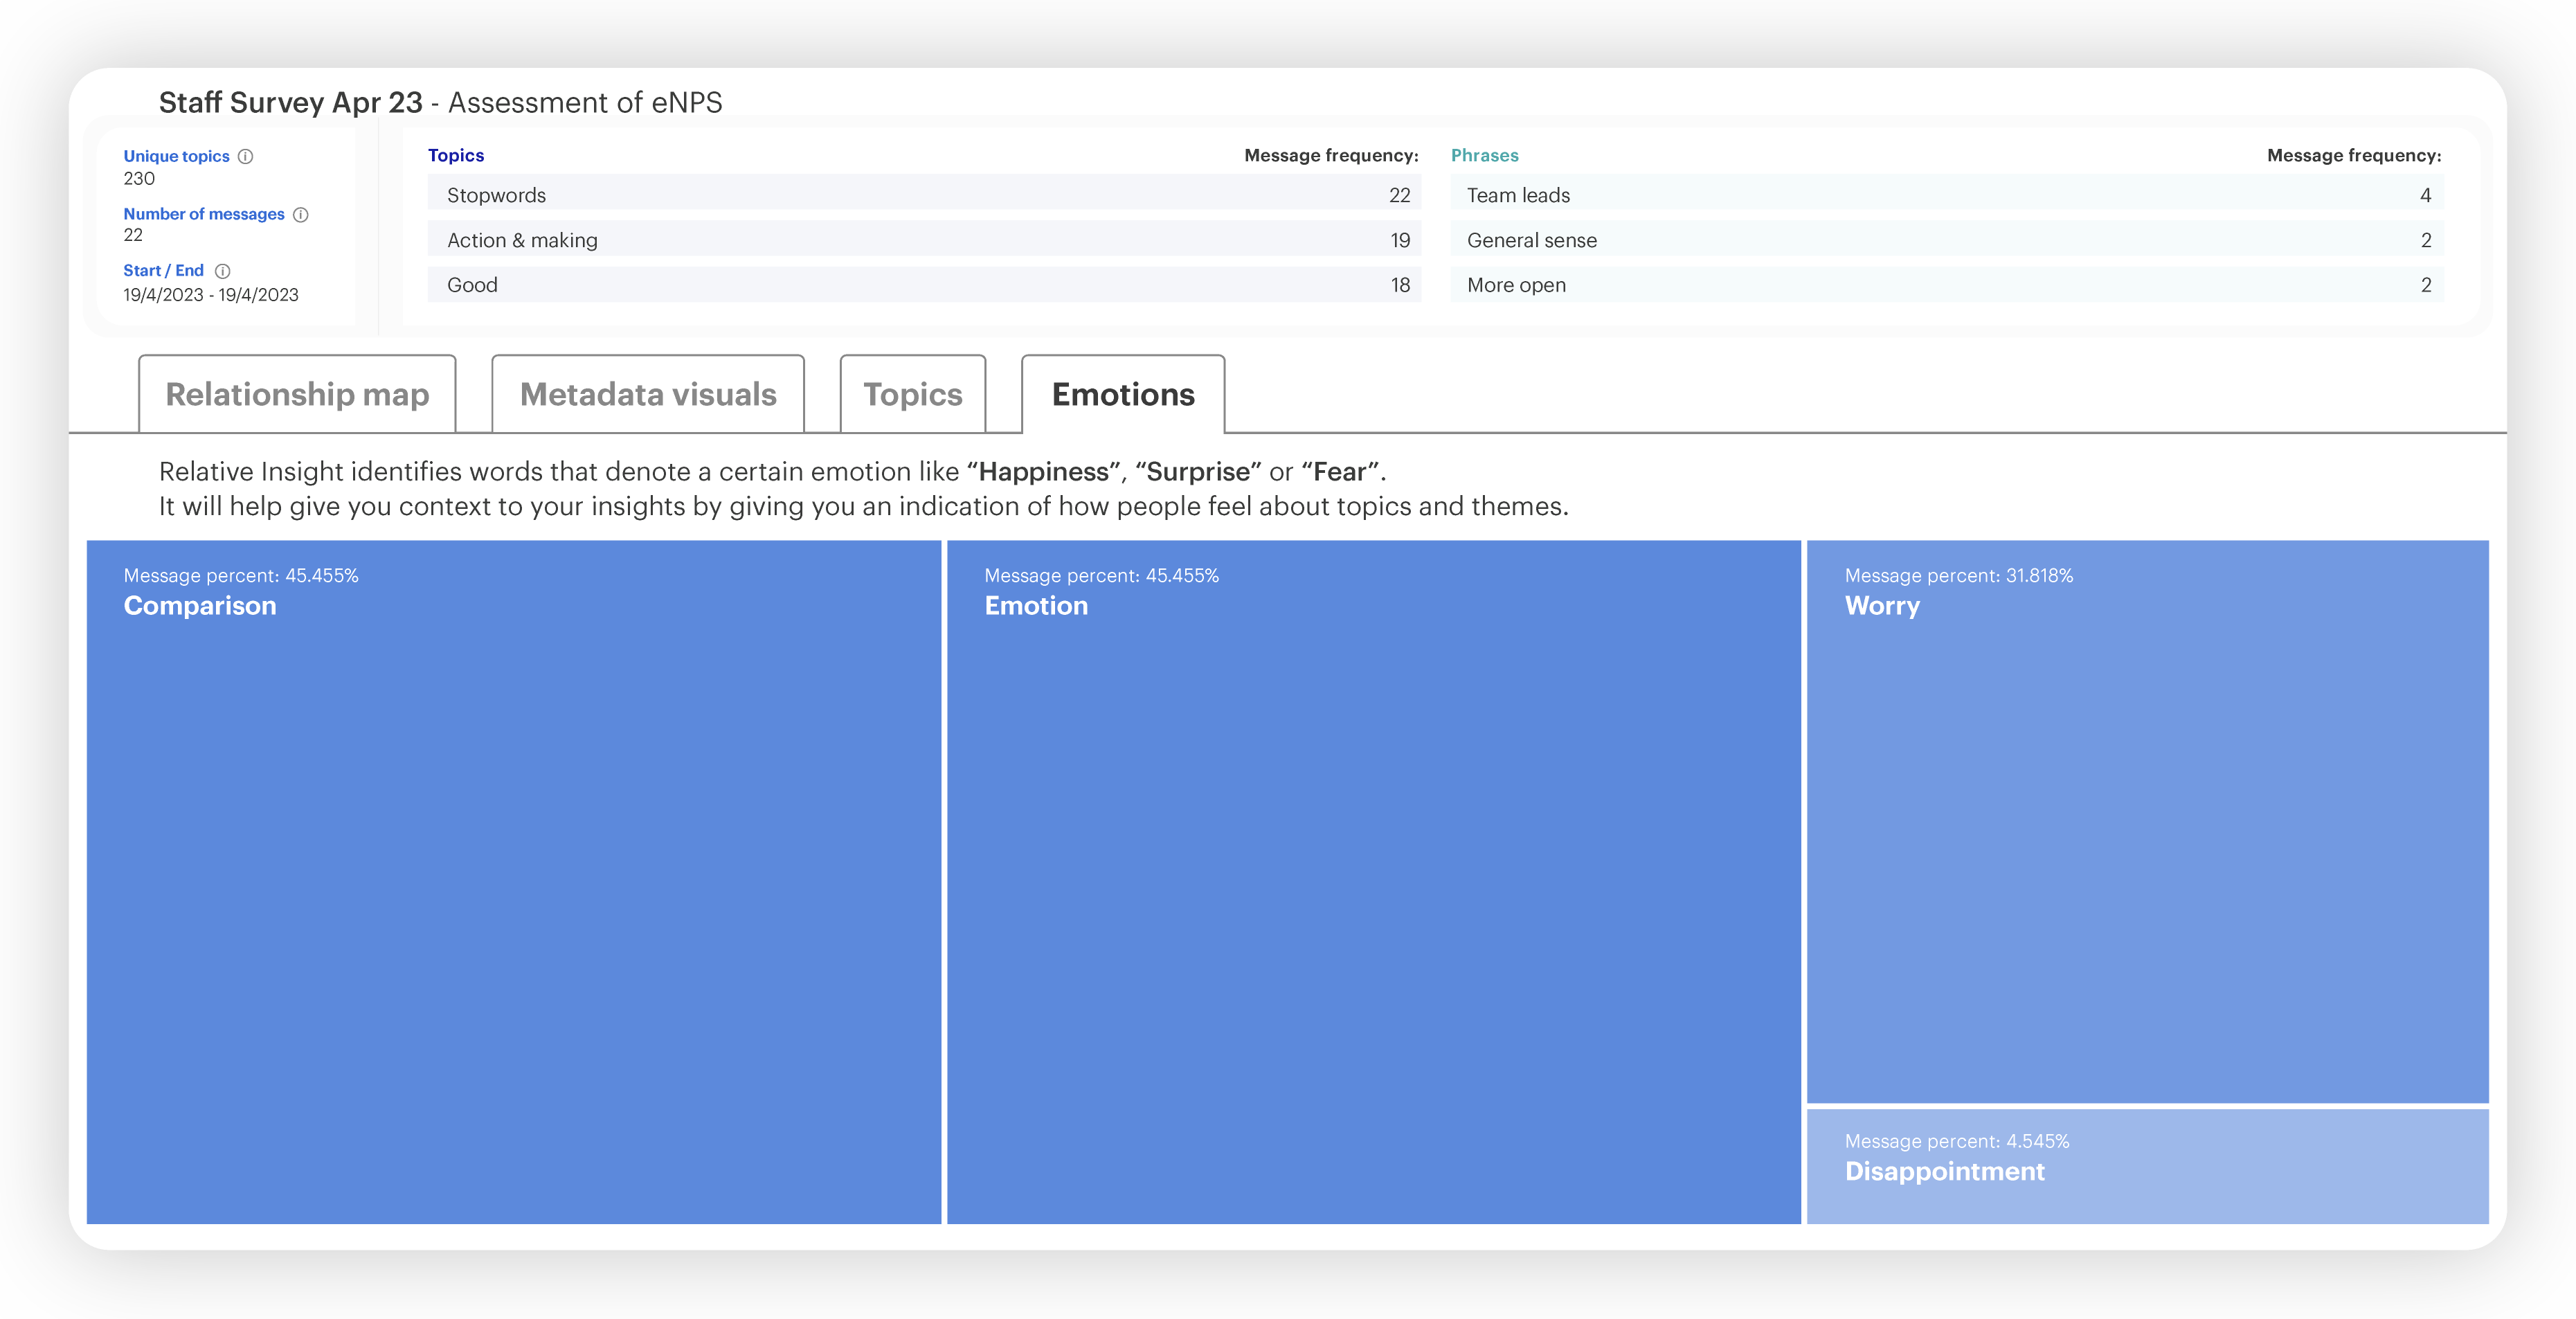
- Emotions overview: A summary of emotions expressed within your data, enriching your understanding of people’s feelings towards specific topics.
Can I get a free trial of Data Discovery?
Yes! Get in touch with our team or try Relative Zero for free today.