
Heatmaps: Uncover and visualize key differences across datasets
Highlight important differences and similarities
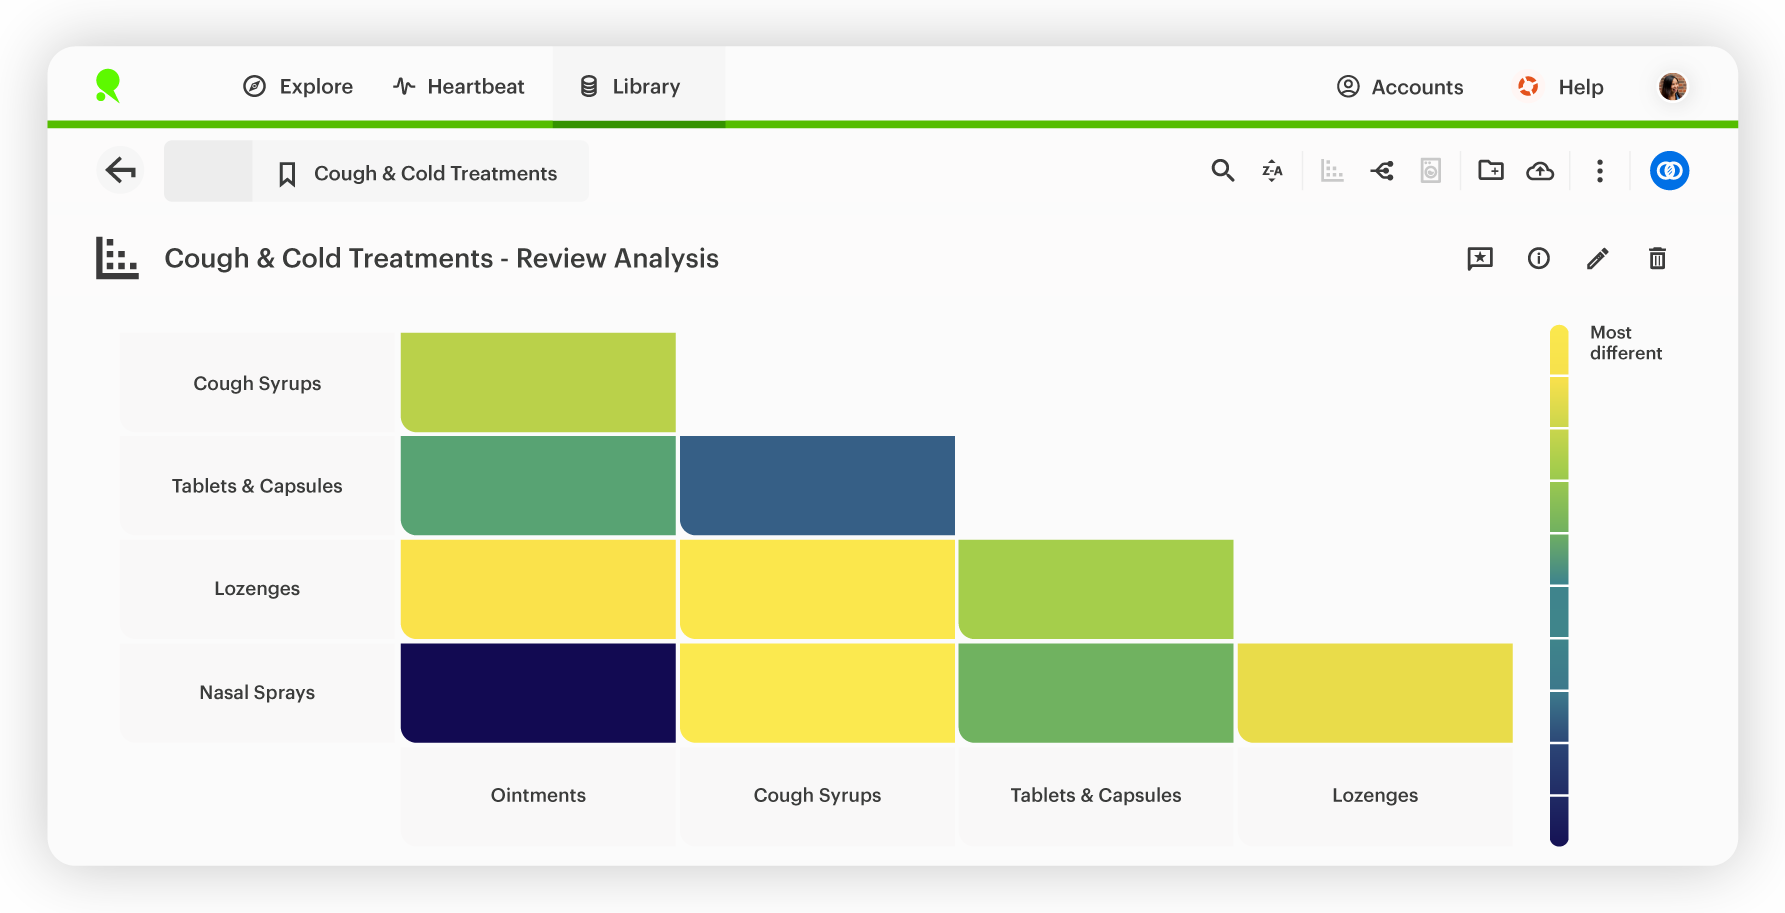
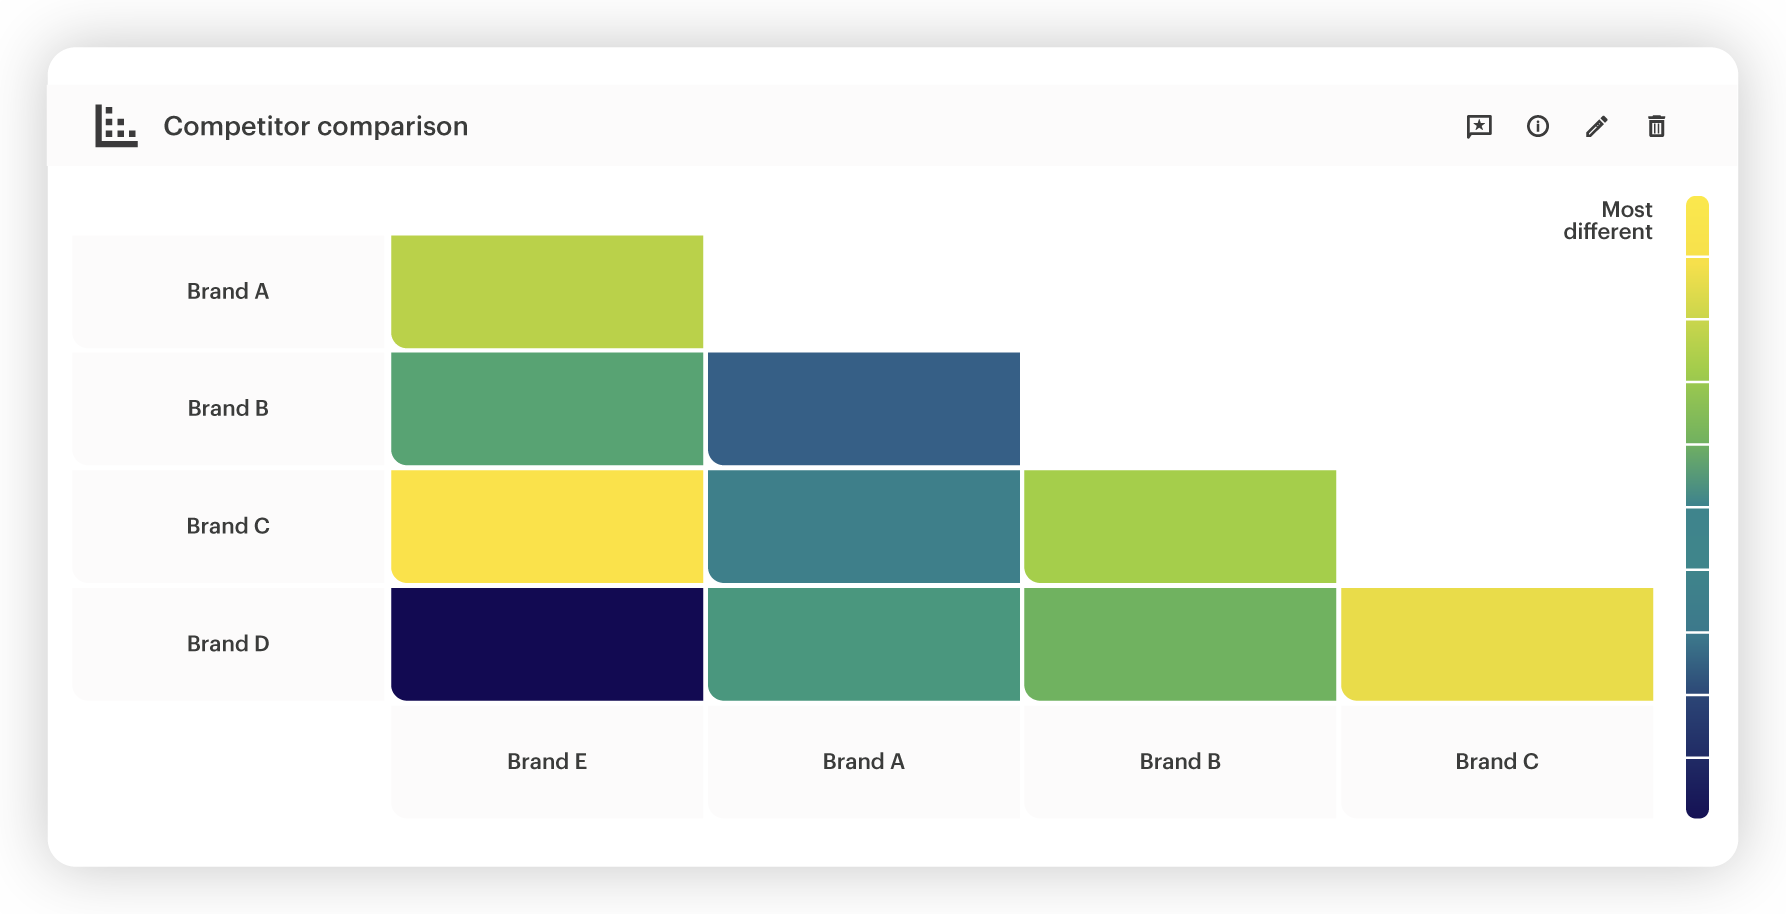
Heatmaps provide a shortcut for understanding how statistically different or similar various parts of your datasets are. This includes audience segments, competitors and geographic regions.
Focus your attention on what matters most
By showcasing where the most and least pronounced differences are, Heatmaps help you prioritize the most important areas for further analysis.
Enhance your data storytelling
Compelling stakeholders to take action goes hand-in-hand with effective data storytelling. Heatmaps can set the scene with a top-level overview, before diving into more specific findings.
Start visualizing your data with Heatmaps today
Heatmaps FAQs
Why should I use Heatmaps?
Creating a heatmap is especially useful when working with a large number of data sets as investigating each individual comparison is often impractical in such situations. Common uses include competitor benchmarking, customer segmentation and geographic market comparisons.
What do the colored tiles on Heatmaps represent?
The color of the tile represents the magnitude of difference for each comparison, worked out in percentiles. Yellow represents the most different pair of data sets while navy blue represents the least different pairing. This can help you focus on the things that matter most in their data and prioritize specific areas for further analysis.