
In with the new – introducing the next generation of Relative Insight!
Over the past several months, our team has been hard at work developing and testing a refreshed user experience and some shiny new features in the Relative Insight platform.
The new look and feel will improve the experience of conducting qualitative analysis in the Relative Insight platform while serving as a foundation for a host of planned feature releases in 2021 and beyond.
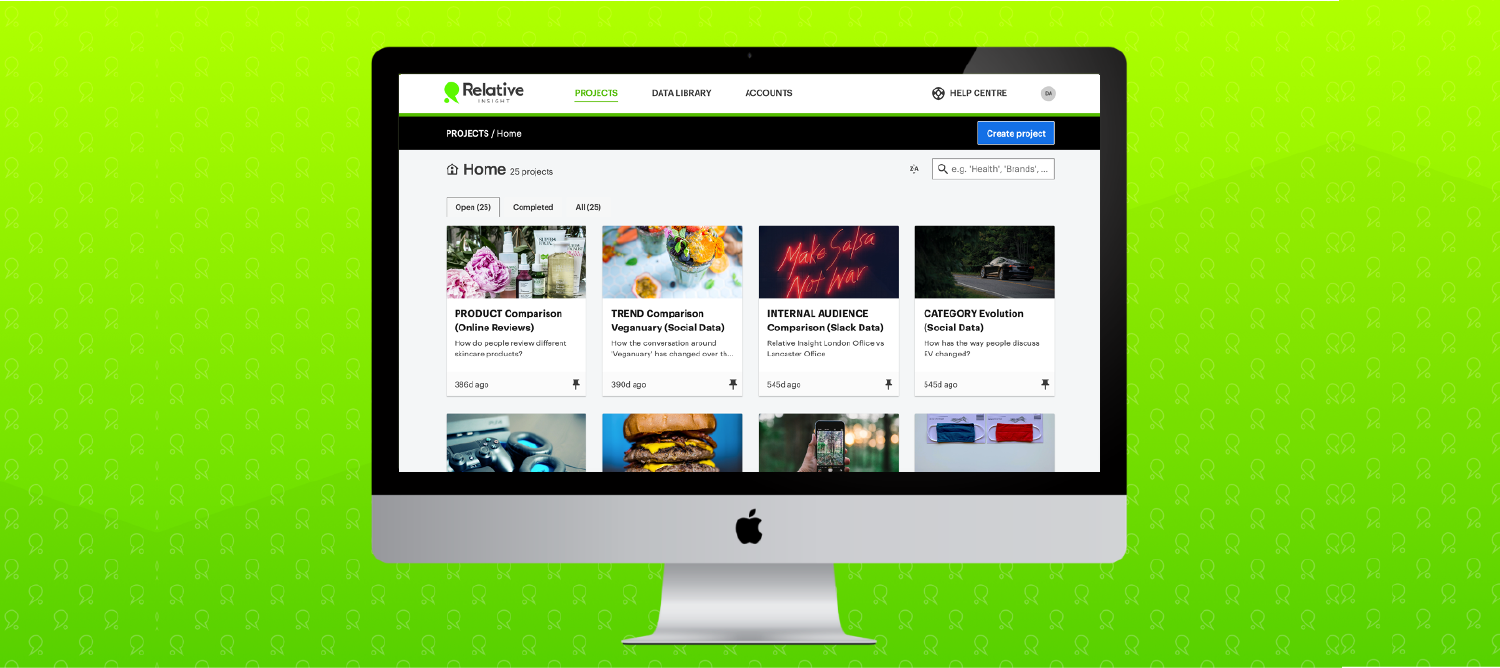
To switch over to the new look, simply login to your Relative Insight account and click ‘Try the new Dashboard’ in the top right corner. The new environment will become default as of March 1, 2021.
Cleaner navigation
The new interface has been designed with ease of navigation in mind. We’ve removed the clutter to help you get from data to insights quicker and with greater ease.
Clear and consistently placed blue action buttons will help you seamlessly manage the five stages of your project from inception through to the creation of insights. Hovering over key elements will reveal additional action options.
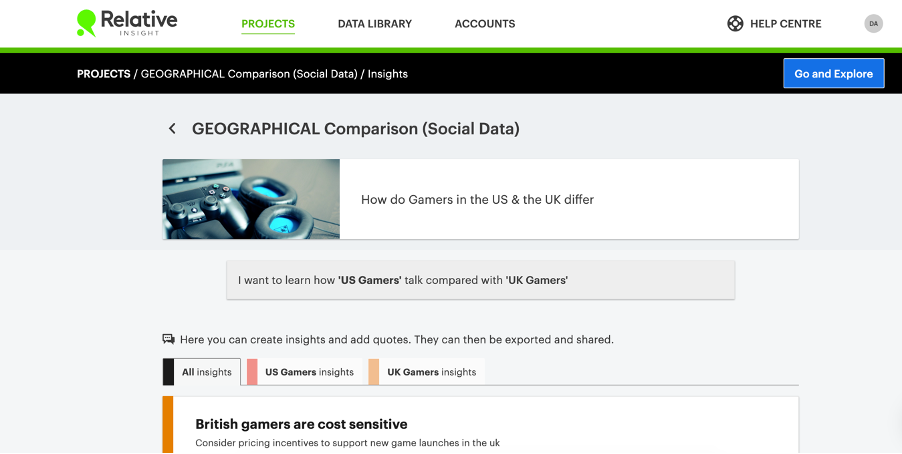
A new look for insight cards

We’ve redesigned insight cards to give you more space to showcase the details that matter. Include more discoveries from your comparisons along with verbatim quotes to beef up your insights and deliver all the context your stakeholders need.
When insight cards won’t quite do the trick, we’ve prepared a library of slide templates you can use to showcase your work.
Project complete
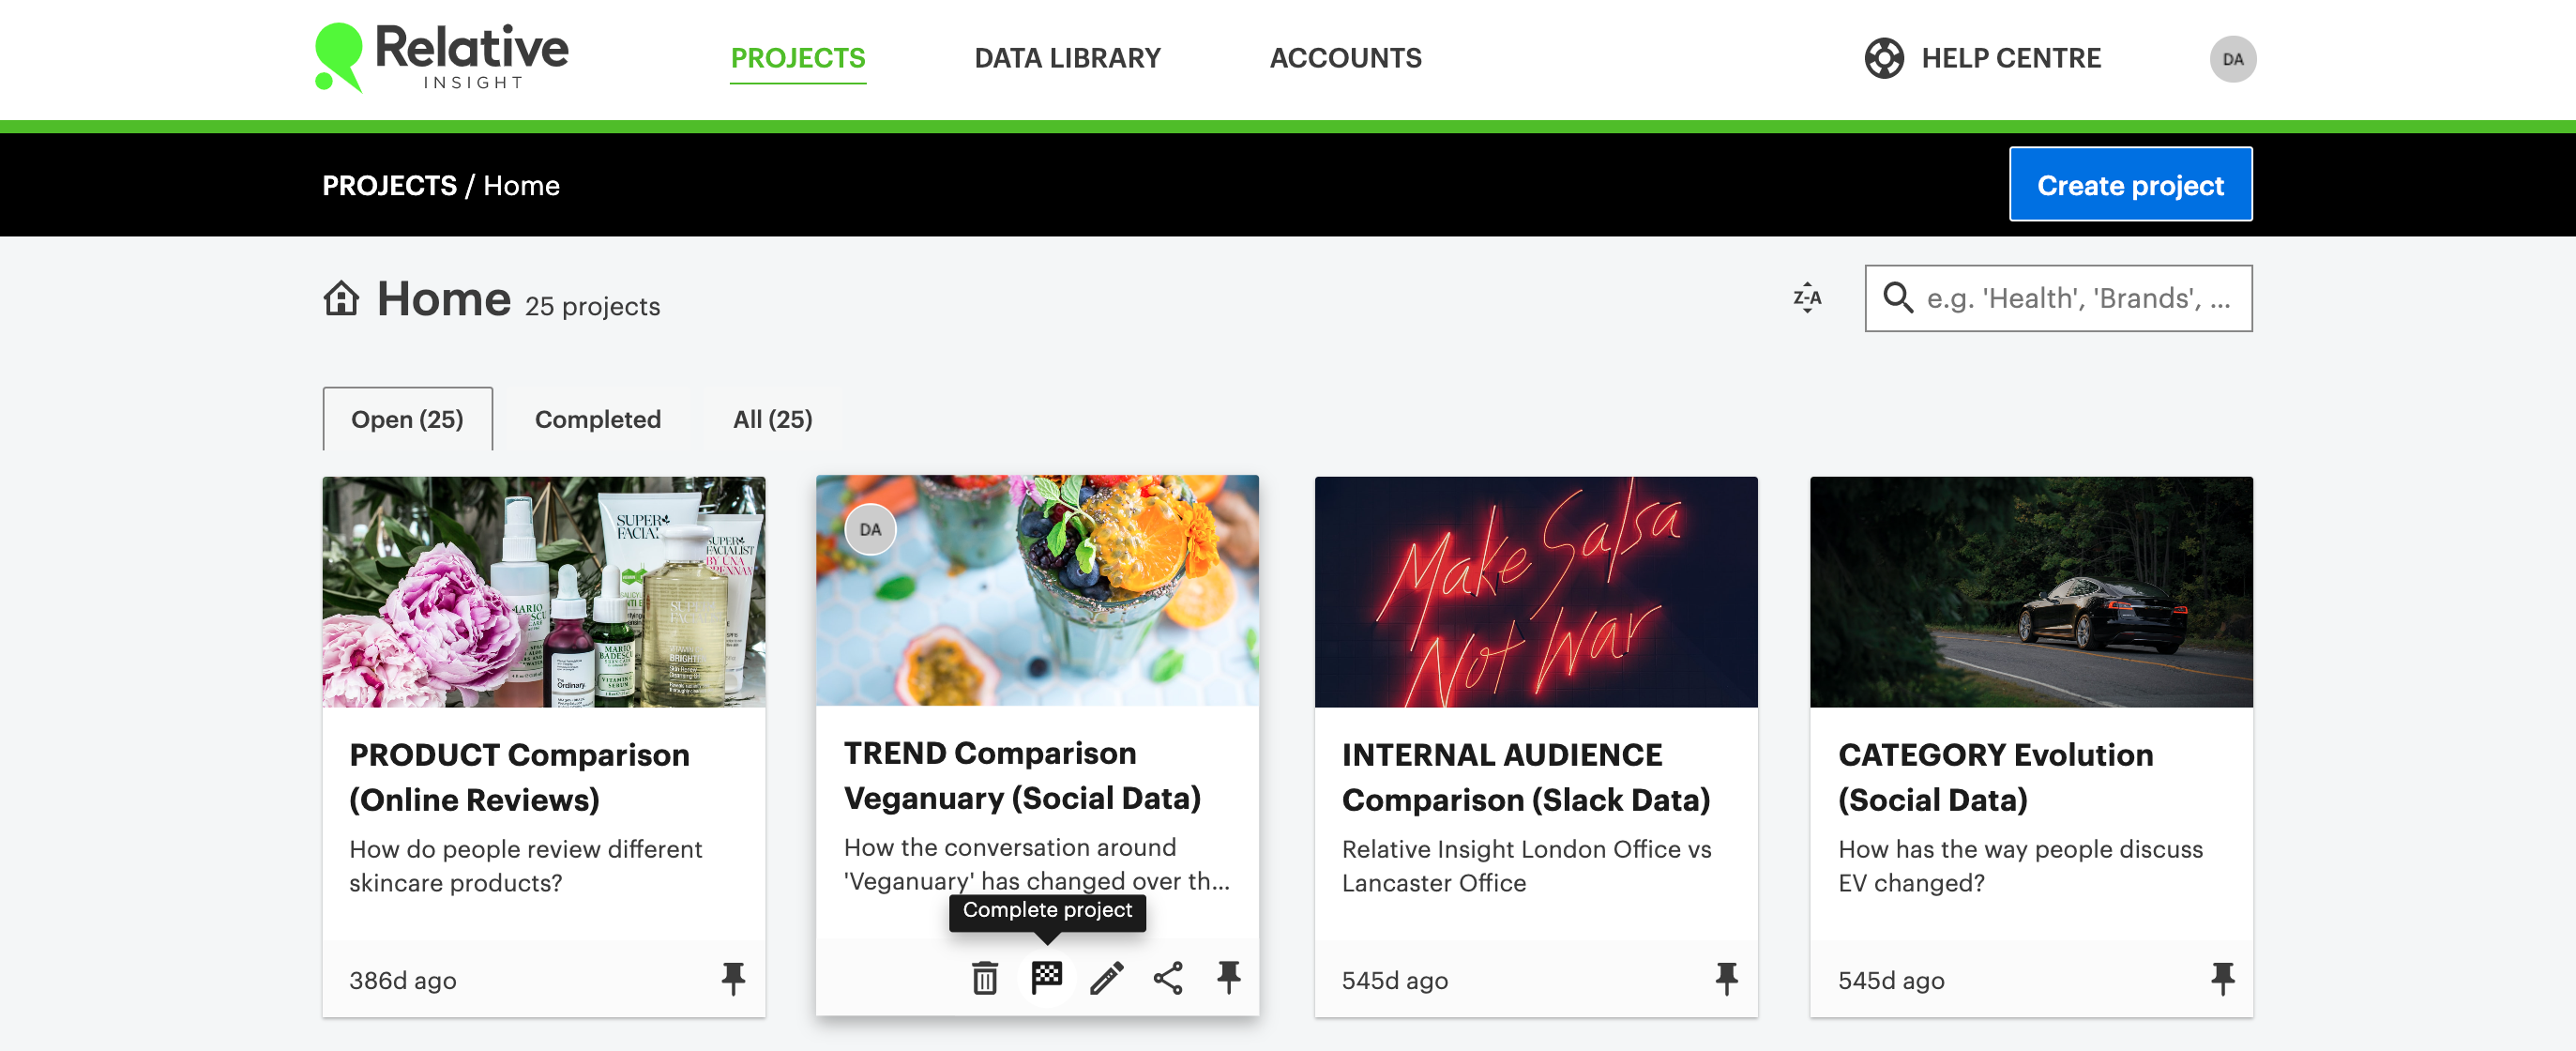
To help you keep your projects dashboard organised, you can now mark a project as complete. Projects can be marked as complete manually from the project dashboard.
When this is done you will be prompted to complete a short survey to helps us understand how useful you are finding the platform. Otherwise, projects will be marked complete automatically eight weeks following project creation. Completed projects will be moved to the ‘completed projects’ tab where you can continue to view your past work.
Once marked complete, projects become read-only.
Bulk data cleaning
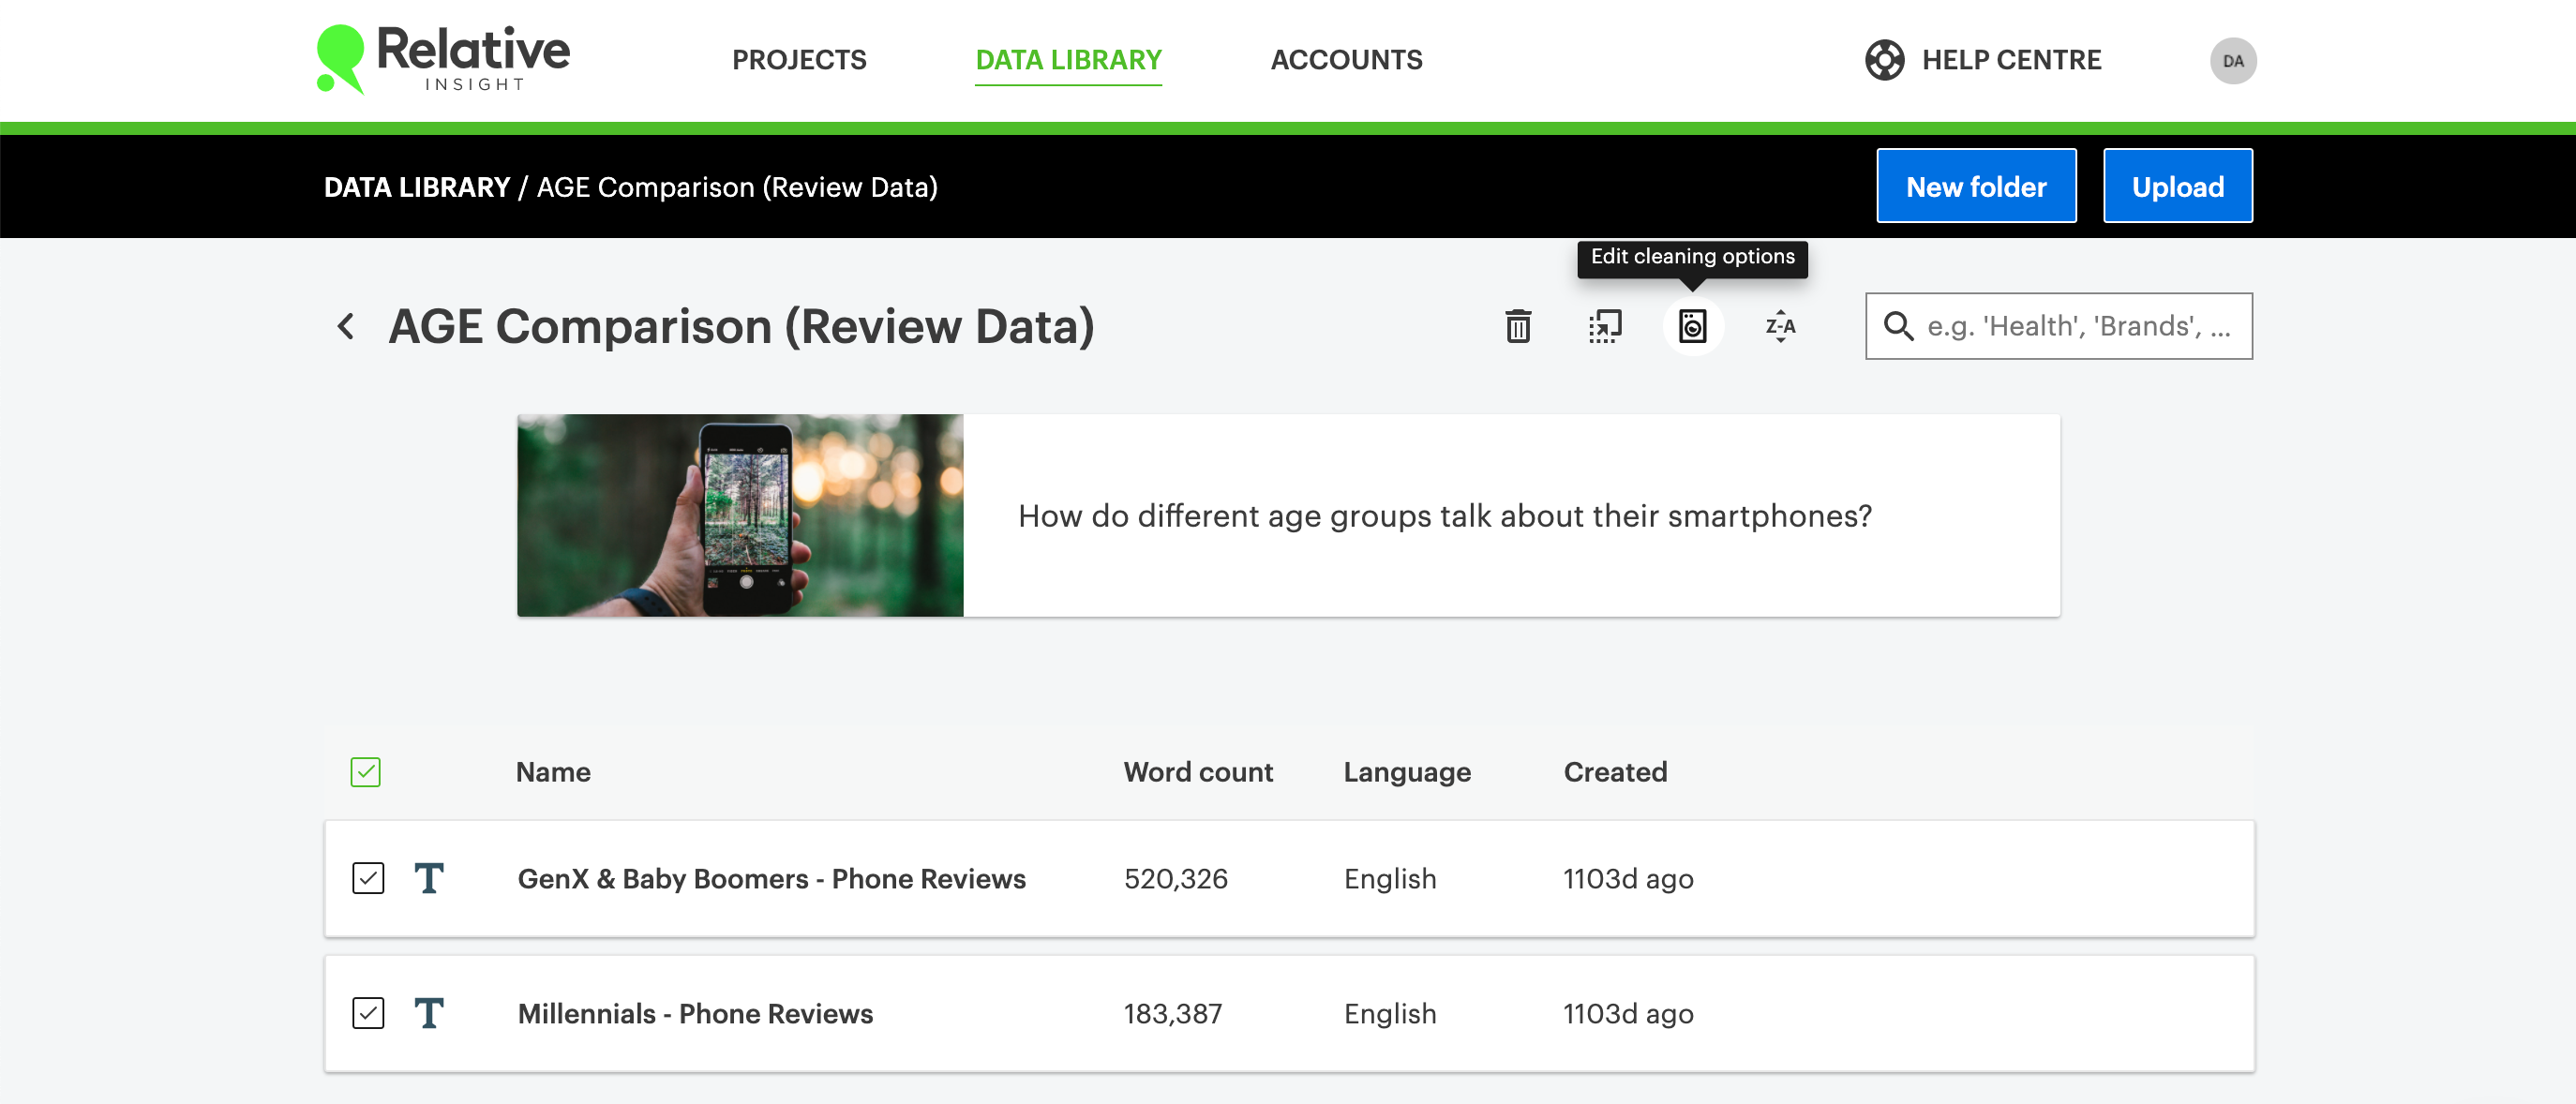
Data cleaning is one of the most commonly used features of the Data Library – helping you remove data that may distort your analysis. Previously, data cleaning options had to be selected at the time of upload. With bulk data cleaning, you can apply cleaning options at any time via the data library and can apply changes to multiple language sets at once.
Simply select the applicable language set(s) within your Data Library and use the washing machine icon at the top of the screen to apply cleaning options.
Build ‘NOT’ comparisons in one-click
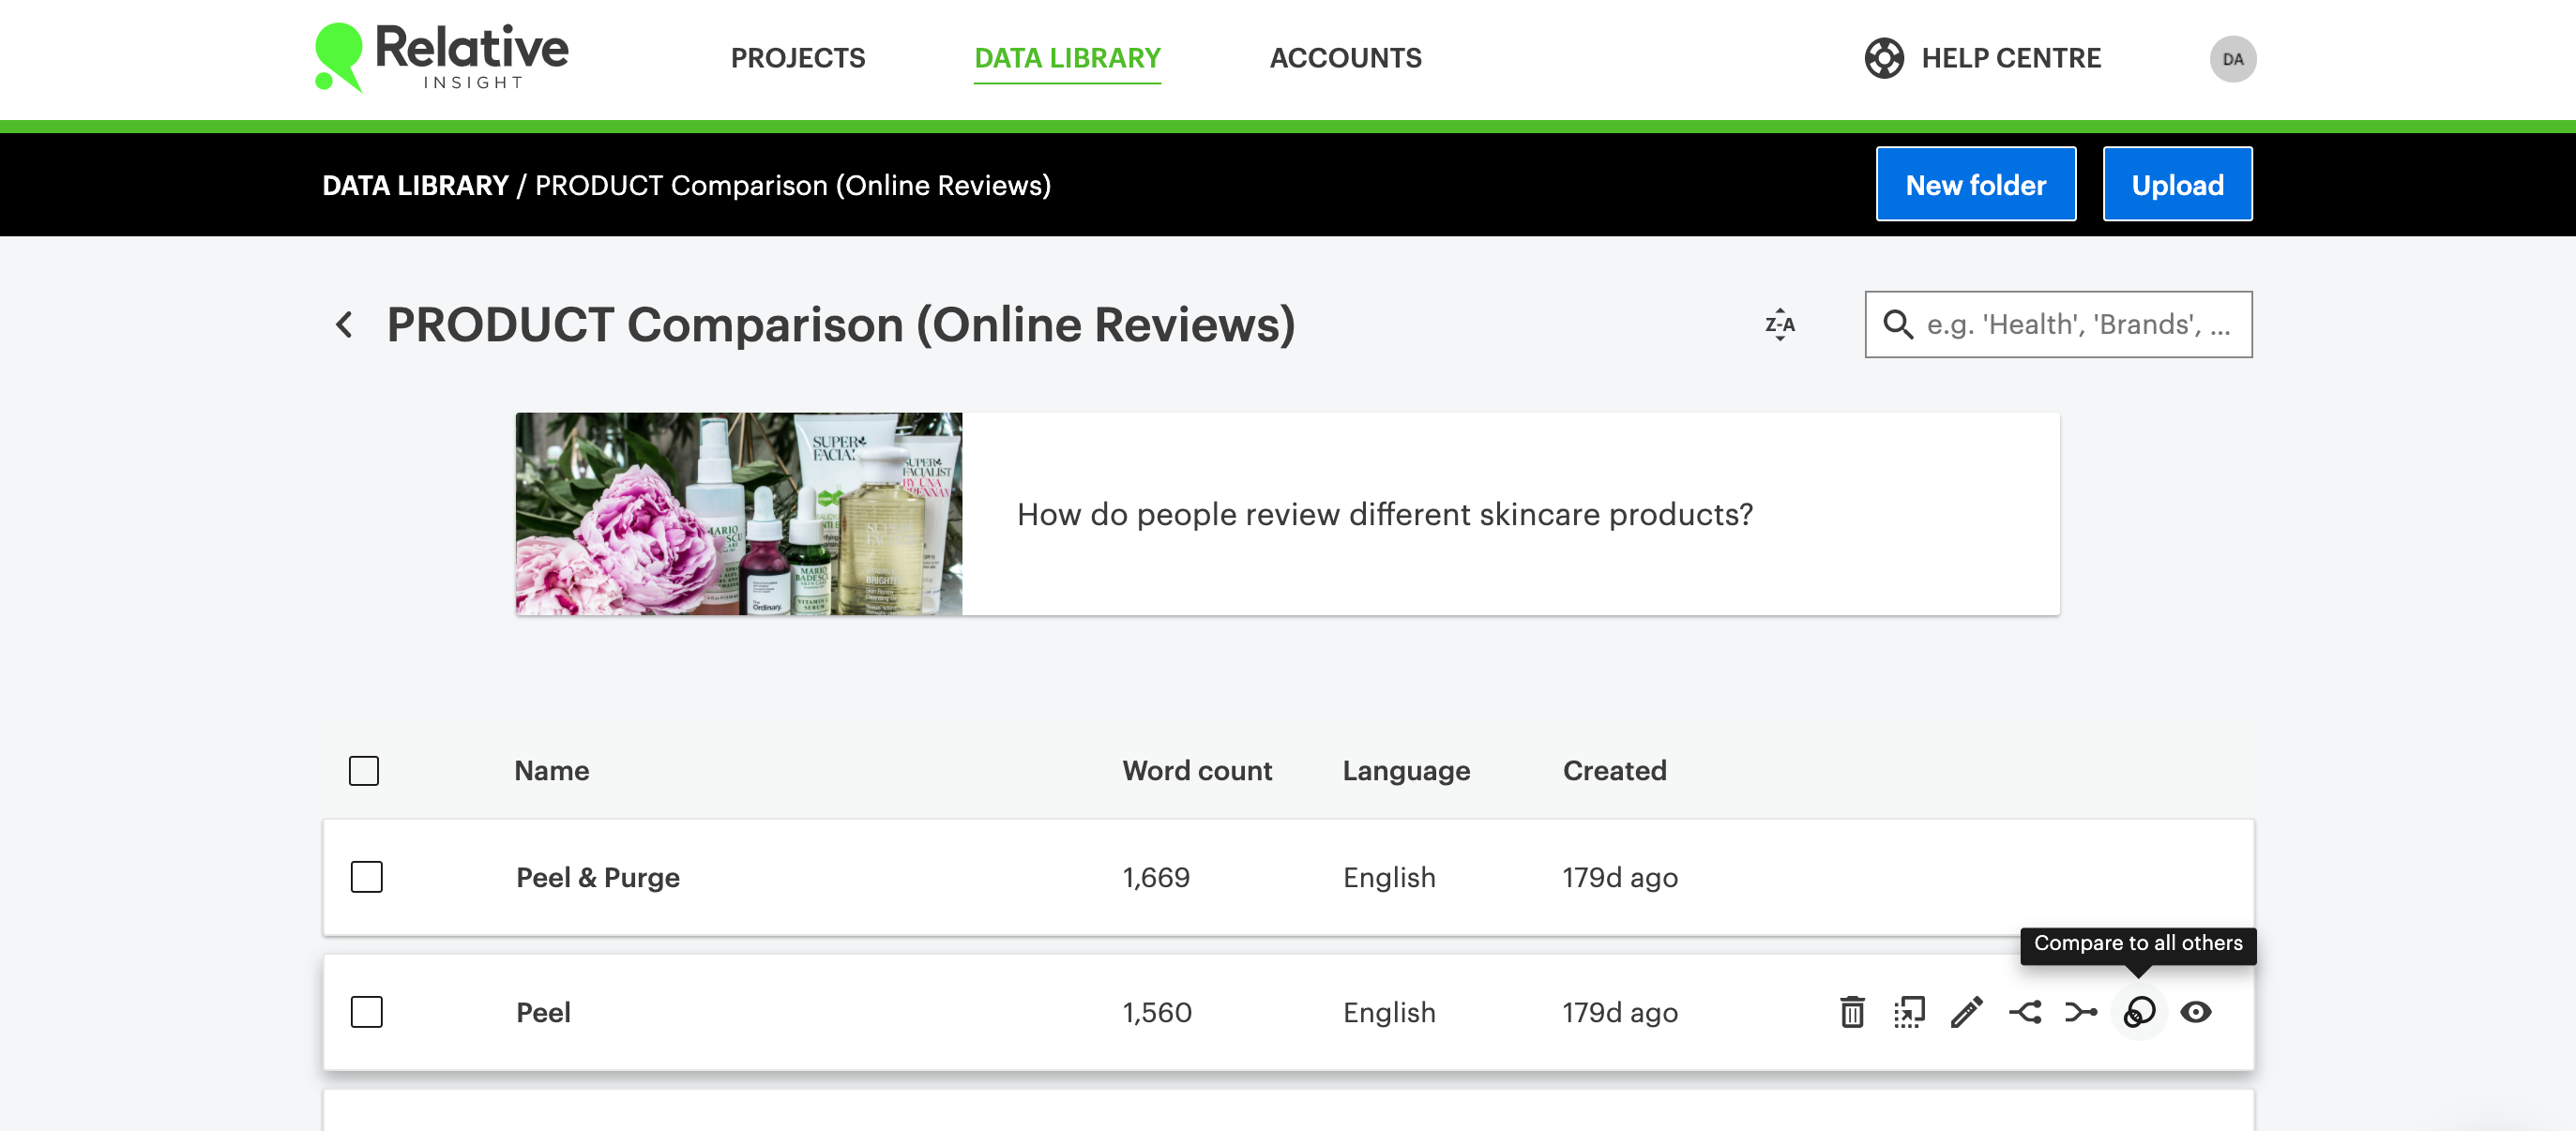
‘NOT’ comparisons are useful when you are comparing more than two language sets, and are commonly used to support geographic, competitor and product positioning analyses. ‘NOT’ comparisons allow you to compare one language set against a combination of all other language sets in the project – surfacing what makes each unique.
To create a ‘NOT’ comparison, hover over the applicable language set that you want to isolate and select the Venn diagram icon to ‘compare to all others’.
Coming soon: smart uploads!
The days of worrying about the format of your data are over! Stay tuned for updates over the coming weeks about this exciting new feature – and please speak to your account manager if you have any questions.