Pineapple or no pineapple? What does your pizza preference reveal about you?

By Beth Thomas
Workplace harmony is usually very reliable at Relative Insight HQ. Except, that is, on the occasional Friday afternoon when we (used to) order in a pizza to share as a team treat.
It’s like getting pizza in with any group; you’ve got to get a margherita for the fussy ones who won’t eat anything else, you’ve got to get a couple of veggie ones because they’re often the nicest, and you’ve got to get in some sort of pepperonichickenbeef monstrosity for the full-on carnivores.
This would be tricky enough alongside the associated juggling of crust thickness and pan-sizes, yet still THE DEBATE always has to come up – the same debate that has launched a thousand memes.
A certain Data Scientist (who shall remain nameless…), can’t help but raise it every time. At Relative, you’d hope we’d know the infinite power that language can have and wield it with care, but no, Mr Data Scientist always has to wade in; “That sounds fine. Just don’t get Hawaiian. People who like pineapple on pizza are gross.”
Immediately, the entire office splits in two. The long-suffering ananas-advocates stand on one side, while the pineapple persecutors stand on the other. The Friday feeling is destroyed by controversy.
Seeing as we’re all so looking forward to being able to share food again, we’ve decided that this debate cannot continue once we’re all back in the office. With Relative Insight’s technology at our disposal, its statistical rigor is the only way to answer one of life’s greatest questions.
Who are better: pineapple lovers or pineapple haters?
The super-scientific method™
I’ve created two Audience Language Models (ALMs), from Twitter; one for people who say they like pineapple on pizza, and another for those who said they hate it. Keep in mind, we’ll be analysing ALL their language, not just their opinions on pizza.
Using our comparative method, we’ll be able use social insights to discover – beyond dispute – who the better collection of human beings are. Will we discover that people who hate pineapple are monsters? Are they the type of people who stick chewing gum to public seating? Probably. Who can say?
We will, of course remove any bias to the experiment by comparing anonymised datasets. None of us, (not even the writer) will know which ALM is which, until the very end.
So here we have them. Group One and Group Two.
Inward vs outward facing:
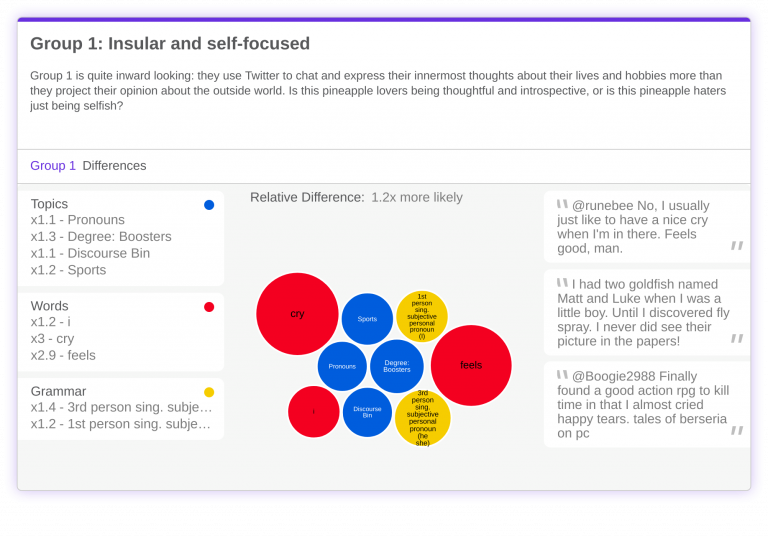
The most fundamental difference between these two groups is their focus. Group One is very focused on their own lives and hobbies, while Group Two is consumed by projecting outwards, and making their views on the world known.
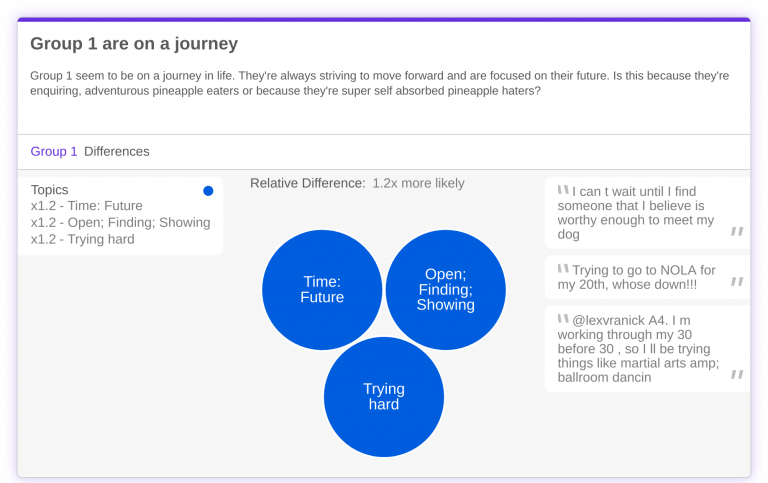
Group One are the protagonists in their own lives: they’re 1.2x more likely to use Twitter to chat to real-life acquaintances, and to express their feelings about their day-to-day lives. They talk about their hobbies (gaming being a particular favourite) and express their emotions regularly. In a similar vein, they spend more time than their compatriots in Group Two thinking about their future, by talking about things they want to try, places they want to go and people they want to meet.
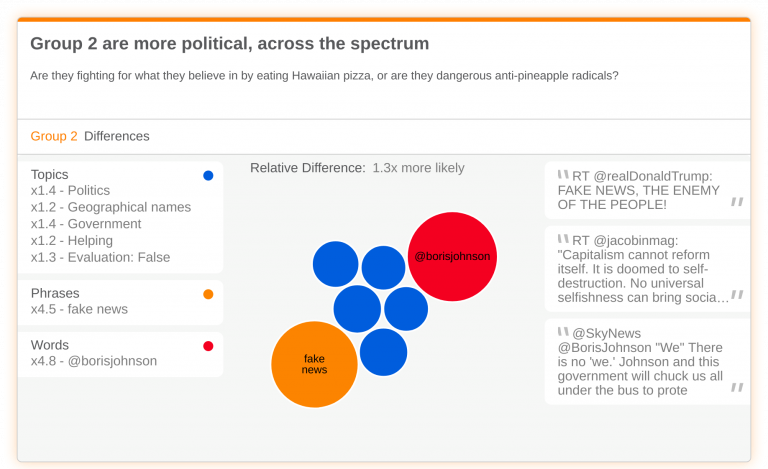
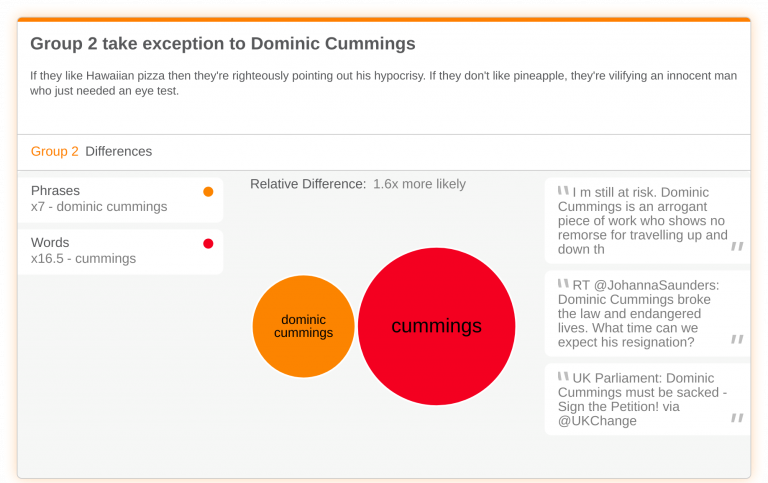
In contrast, Group Two use Twitter for political means by using the platform to project their political opinions about the world. Wherever they are on the political spectrum, they’re 1.3x more passionate about expressing their views and making their voice heard. Interestingly, they’re 1.6x more likely to specifically have expressed objection to Dominic Cummings’ recent little lockdown faux pas.
Cheery vs grumpy:
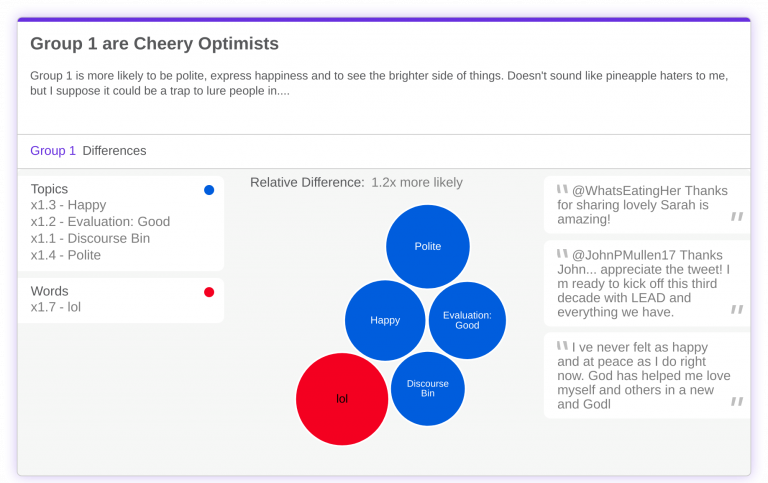
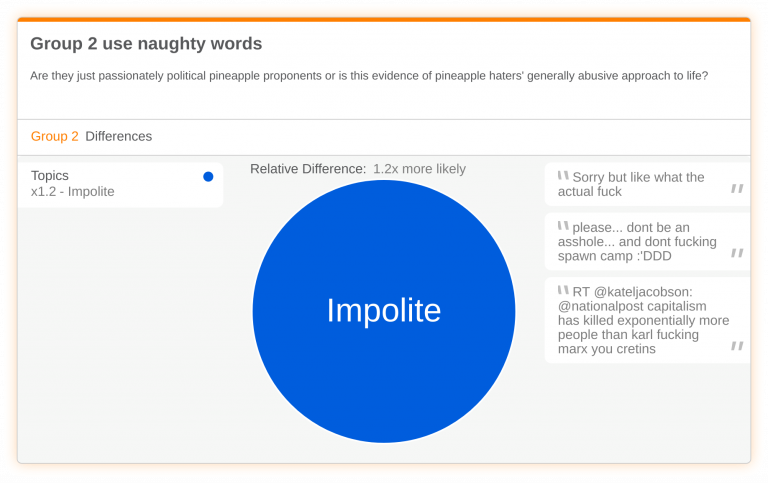
Another distinct difference is in the sort of emotional language used by Groups One and Two. People in Group One talk about feeling happy and celebrate things that make them feel good 1.2x more often, while Group Two use 1.2x more erm…risqué (read strong and sweary) language when putting their views across. But being more political, is it any surprise they get a little more angsty?
But who are the foodies?
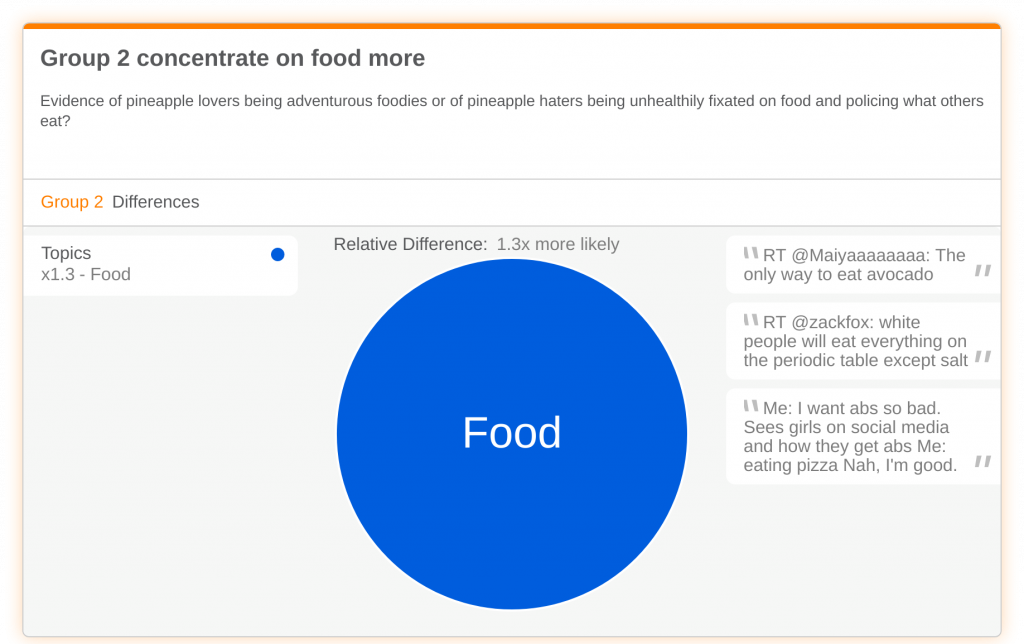
Compellingly, Group Two has a 1.3x higher tendency than those in Group One to discuss food and to talk about what they’re eating, but what can this mean in terms of THE DEBATE? Could we have discovered that the people in one particular group is made up of a higher proportion of foodies than the other, which means they know what they’re talking about? I don’t think I can cope with this level of tension….
But before the big reveal, a point in both their favour:
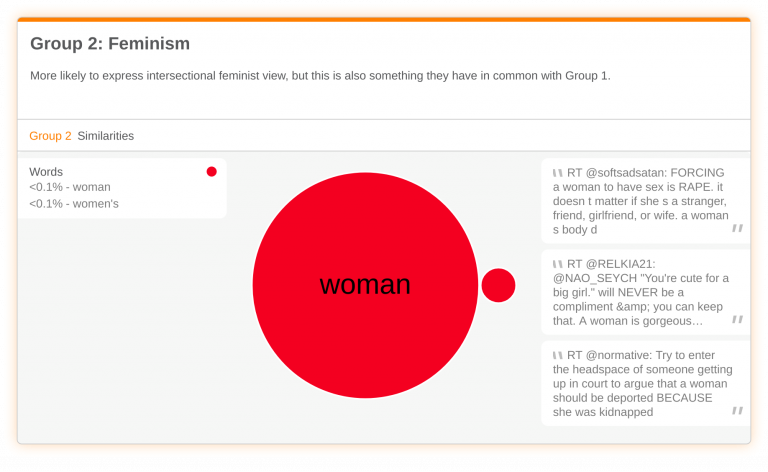
Both groups are pretty progressive in their views about gender politics. They share advocacy for the trans community, (though those in Group One are more common in this), as well as advocacy of intersectional feminism, (with Group Two being more common in these side of things). So no matter the result, it’s nice to know, that whichever one hates pineapple on pizza, they have at least some redeeming features.
So….who’s who?
After this long and rigorous process, we can now exclusively reveal who is who…Group One were the pineapple lovers and Group Two are the pineapple haters!
It’s obvious now we see it. Of course the pineapple haters would be the dangerous political radicals who swear like sailors and victimise innocent political advisers who just needed an eye test! What chance do the sweet, introverted pineapple lovers have against their campaigns of hate? And OF COURSE the pineapple haters talk about food more; they’re obviously busy policing what everyone else eats!
So yes. Language comparison has proved with 100% accuracy and science, that people who hate pineapple on pizza are actually monsters. How do you like that, Mr Data Scientist?
Relative Insight’s technology can do more than analyse pizza opinions – it can be used to compare any language data sets you can imagine in order for you to discover insights about any audience type or demographic.