Tracking the path to purchase for Halloween costumes

America’s spookiest holiday is vital to the economy, with the National Retail Federation predicting that Halloween 2023 will be worth $12.2bn to retailers. Its value means it’s critical for retailers to know consumers’ path to purchase for a range of products, including Halloween clothes. Text analytics offers a unique form of retail business intelligence to illustrate this journey to vendors.
With outfits to buy, candy to prepare and parties to attend, consumers must plan their Halloween carefully. However, this presents a challenge to retailers. Whether they’re operating online or physical stores, targeting consumers with the right products at the right moment – and having the supply to match the buyer decision process – is vital.
While brands often rely on quantitative data to track purchasing trends, qualitative data illuminates consumers’ path to purchase before, rather than after the event. To demonstrate how, Relative Insight used a social listening tool to gather conversations from Americans about Halloween clothes.
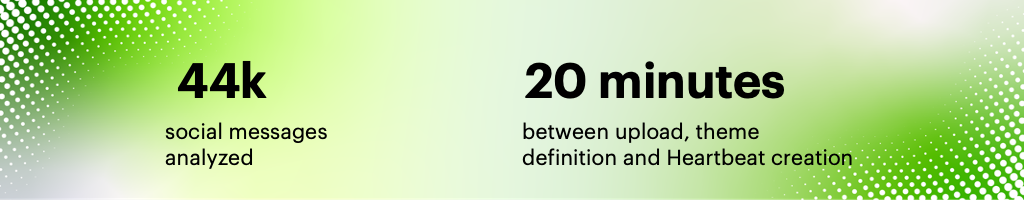
Incorporating all messages from the start of fall to October 31st in 2023, this amounted to 44,000 posts containing millions of words. Despite this volume of text, Relative Insight’s text analytics tool efficiently charted the path to purchasing Halloween costumes using two platform features: Explore and Heartbeat.
We used Explore to compare conversations week by week, discovering the topics, words and phrases that were more prominent in each stage of the build up to Halloween. Then, we built themes from the insights gleaned within this initial analysis and plotted them into Heartbeat, visualizing how these themes changed from the start of September through to Halloween.
This combination of text analysis tools illustrated the buyer decision process for Halloween clothes, providing essential retail business intelligence.
September is planning month; too early for Halloween clothes buys
Despite jack-o’-lanterns appearing on doorsteps in the early days of fall, this enthusiasm for Halloween doesn’t extend to costumes. Audiences used the word ‘early’ 2.3x more in the first week of September, as well as the word ‘already’ 2.8x more across the early weeks of this month.
“I don’t get it, people are already buying their outfits for Halloween.”
However, in spite of this wariness of commitment, people weren’t averse to getting a head start their Halloween costumes. In the early part of fall, they discussed ‘ideas’ 1.8x more. They were also 3.1x more likely to use the word ‘planning’, highlighting that their path to purchase involves consideration, rather than spontaneity.
“50 days til halloween and I don’t even have a glimmer of an idea for a costume!!! I need to get planning!“
Using these insights to define the themes of earliness and preparation, Relative Insight Heartbeat demonstrates how prevalent these areas of discussion were from the start of fall to Halloween itself. The Heartbeat chart shows proportionality between these two themes. Despite consumers complaining it was too early to buy things for Halloween, that didn’t stop them from planning what to buy.
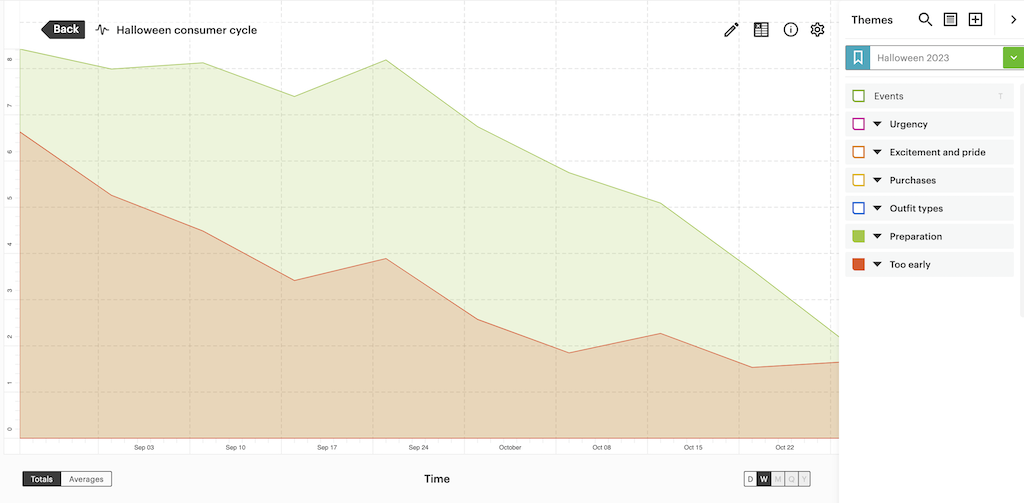
While discussions referencing that it’s too early for Halloween decline throughout fall, people talking about ideas and plans peaks in the final week of September. Combined with other insights from our analysis, this suggests that most consumers will decide on a Halloween outfit by the start of October.
Buyer decision process accelerates at the turn of the month
As the calendar turned to October, consumers’ path to purchase shortened. There were clear signs that September planners were beginning to buy. However, those less prepared were also expressing their desire for a costume.
People talking about Halloween clothes expressed greater urgency about getting what they needed. They used word ‘need’ 1.4x more and discussed making a ‘decision’ 2.1x more.
“I need to decide want I want to dress up as for Halloween I’m not being left out this year.“
References to buying costumes were most prominent in the first full week of October. Words relating to the topic of ‘sales’, such as ‘buy’, ‘ordered’ and ‘purchase’, appeared 2.3x more during this week. However, many consumers were taken by surprise at how much costumes cost, with the word ‘expensive’ overindexing 2.0x more.
“Why are Halloween costumes so expensive???? Why is it damn near $100 for a decent costume???“
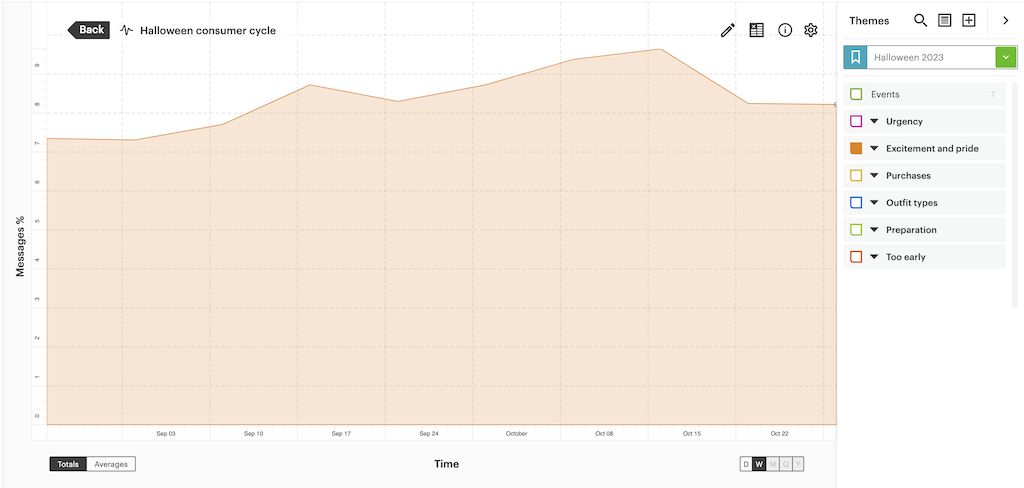
Both of these sets of insights can be distilled into themes. Labelled as urgency and purchases on the Heartbeat chart, once again there’s a correlation between the two.
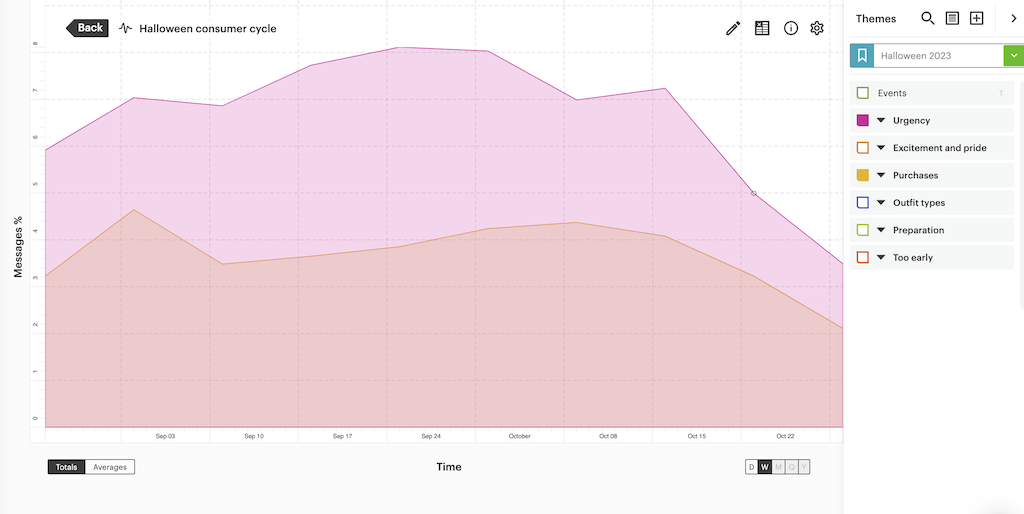
Both themes rise and fall at similar points. Examining verbatim messages reveals that the spike in purchases in early September features consumers discussing what they’d buy for Halloween, while the upwards trend from mid-September onwards illustrates people actually making purchases.
Interestingly, both themes decline from the middle of October. This suggests that consumers aren’t making last-minute Halloween clothes buys in large numbers. The path to purchase concludes for most around 10 days before the event. This is vital retail intelligence for Halloween costume vendors.
Exciting consumers and waning parties
The retail business intelligence gleaned from Relative Insight’s analysis of text data includes consumers’ Halloween experiences in their own words. This enables companies to communicate effectively, targeting the right people with the right messaging at the right time.
As the big day approached, conversations turned to outfit self-congratulation. Consumers were 5.2x more likely to use the words ‘cute’, ‘sexy’ and ‘cool’, while also describing outfits as ‘beautiful’ 2.4x more. Audiences were also 1.5x more likely to say how ‘excited’ they were for Halloween during mid October.
“I’m ready for halloween my costume so cute.“
How can retailers tap into consumers’ pride and excitement? The Heartbeat chart demonstrates that this theme peaks in the middle of October, meaning that people participating in Halloween who haven’t yet bought a costume will be awash with peers’ enthusiasm leading to fear of missing out. Brands should lean into this during mid-October, highlighting that people without a costume will miss out on Halloween fun.
Speaking of fun, people discussing costumes – unsurprisingly – spoke about Halloween events more prominently the closer they got to the day itself. They were 3.2x more likely to reference ‘events’ in the penultimate week, particularly Halloween parties.
“My costume came in and it slays enough for me to be outside so now I gotta figure out which Halloween party on Halloween I’m going to and who I’m dragging with me.“
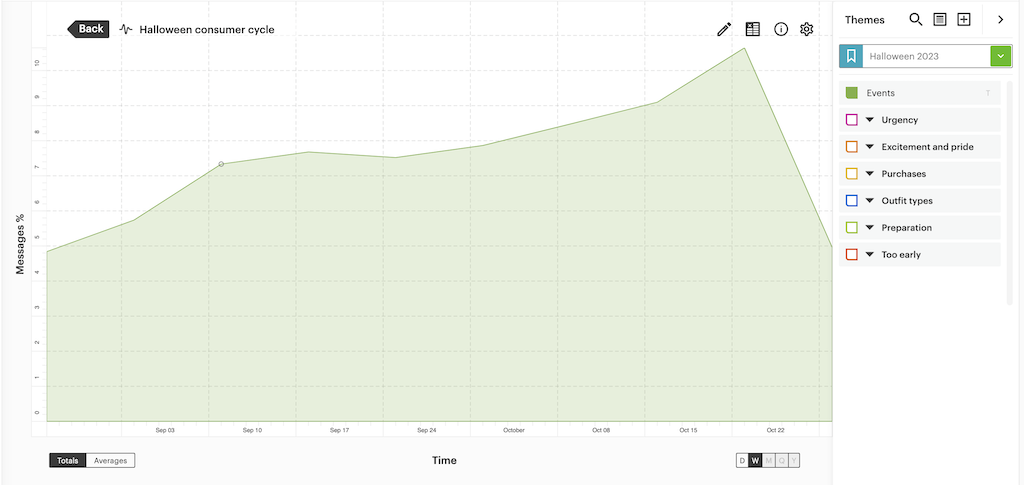
However, the Heartbeat chart illustrates an interesting and surprising trend. After discussions around events and cosutmes peak in the penultimate week, they fall dramatically. This piece of retail business intelligence demonstrates that there’s a shrinking window for brands to incorporate events into costume promotion, with interest falling significantly in the final week of October.
Visualizing consumers’ path to purchase
Relative Insight analyzed and visualized social conversations to reveal consumers’ path to purchase — and provide vital retail business intelligence when it comes to Halloween clothes.
Using a combination of Explore and Heartbeat, our analysis demonstrates a clear consideration period where consumers are researching and deciding on their costumes. During this timeframe, retailers promoting costume ideas should mirror consumers in using the words ‘cute’, ‘cool’ and ‘beautiful’ to resonate.
The start of October signals consumers’ shift from consideration to purchase. It’s also when people less meticulous in planning their outfit show urgency. Retailers should ensure stock is available to cater for both of these types of buyers.
As the month progresses, consumers’ attention turns from what they’re wearing to where they’re wearing it. Retailers selling Halloween clothes have a window to tap into FOMO for people wanting to go to parties but lacking an outfit. However, this window shuts a week before Halloween itself, meaning retailers still using this tactic in late October will see its effectiveness diminish.
The Relative Insight platform analyzes social conversations to identify and track a range of themes and trends — not just spooky season. Speak to one of our experts to find out how the tool helps you extract maximum value from your social data.