
Accelerator AI: Actionable Insights in an instant
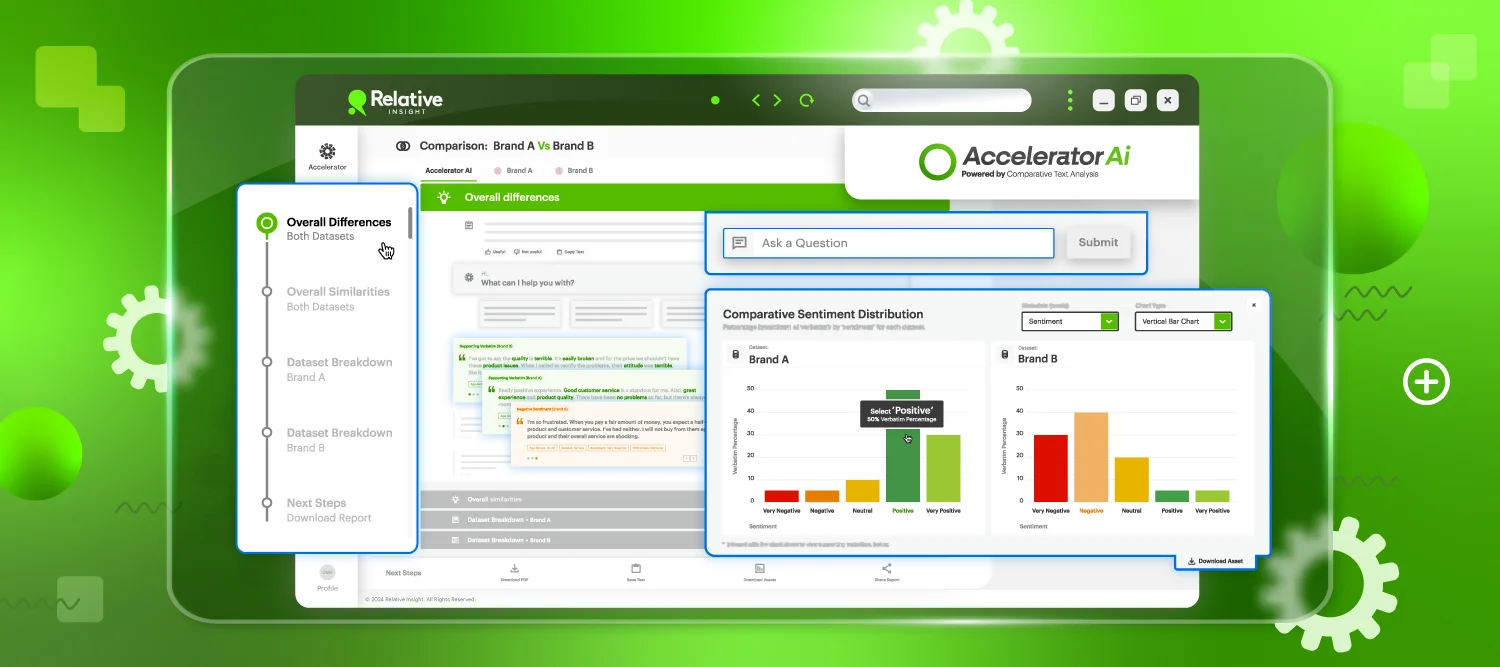
With the release of our latest offering at Relative Insight, Accelerator AI, I am going to provide a small peek ‘behind the curtain’ to see how it works. I’ll explain why it enables a radical transformation of stacks of data into actionable insights in record time.
Accelerator AI is an in-platform report generator that delivers instant, metric-focused and evidence-backed insights. It powers your text analysis, producing a report that brings together critical evidence, identifies key themes, outlines trends, and provides verbatim examples, all without requiring any effort from you.
This means that you can go from uploading your data to fully formed reporting in seconds, streamlining the data analysis process. No manual processes for data exploration and categorizing means that you can jump straight into the ‘what’s going on’ and ‘what should I do about it’.
Evidence-backed reporting in record time
A detailed report focusing on key metrics and evidence, empowers you to make smarter, faster decisions. This amplifies the impact that you can have on driving your business forward. Finally, you can ensure that actionable insights reach those who need them as quickly as possible.
If you haven’t already seen the platform demo, you can witness the transformation in data analytics and customer insight that it enables for yourself.
However, there are lots of other tools on the market which seem to offer similar capabilities. From ChatGPT (we’ve written before about why just rely on that is a bad idea) – to Microsoft’s CoPilot. What sets Accelerator AI apart is its seamless integration with our comparative analysis, giving Relative Insight a distinct edge over the competition.
As a professional analyst, which one would you rather have? A summarization of text? Some text-to-spreadsheet query overlaid on a glorified excel spreadsheet? Or an organized and cohesive report with critical metrics embedded in the output?
The answer is clearly the latter, and here’s how we do it. I’ll use an example to illustrate the process. Note that this approach works with any type of data. Whether it’s customer open-ended responses, review data, internal employee feedback, or the results of a Voice of the Customer (VoC) program.
Delving into the finer detail
Imagine you have just uploaded a dataset (I’m using example data about an imaginary show at my favorite stadium). This data comes with some customer reviews and comments. Each one has an associated NPS score. So, we know already who were big fans of my show, and who disliked it. But there’s far too much data to read and code manually.
At this stage, I also don’t know if there are common themes for what people liked and disliked, or whether individual things were controversial. For example, there was a particular element of my show that the fans disagreed about.
In terms of key decisions, you want to know what was good so you can do it again. And critically, what to change to ensure your paying customers will be happier next time around.
It’s all about comparison…
First, Accelerator AI creates a Comparison Report. This performs a comparison analysis; like you can do in Explore, between the Promoter (NPS 9-10) and Detractor (NPS 0-6).
Because of the way we perform comparison, (not just counting frequencies!) we are able to find the most significant similarities and differences in your data, even if they are of very different sizes.
It automatically identifies the most important topics, words and phrases which occur in the “Promoters” data, and looks at how those same things are discussed in the verbatims of the “Detractors” data. Important statistics are highlighted and supporting verbatims are shown too.
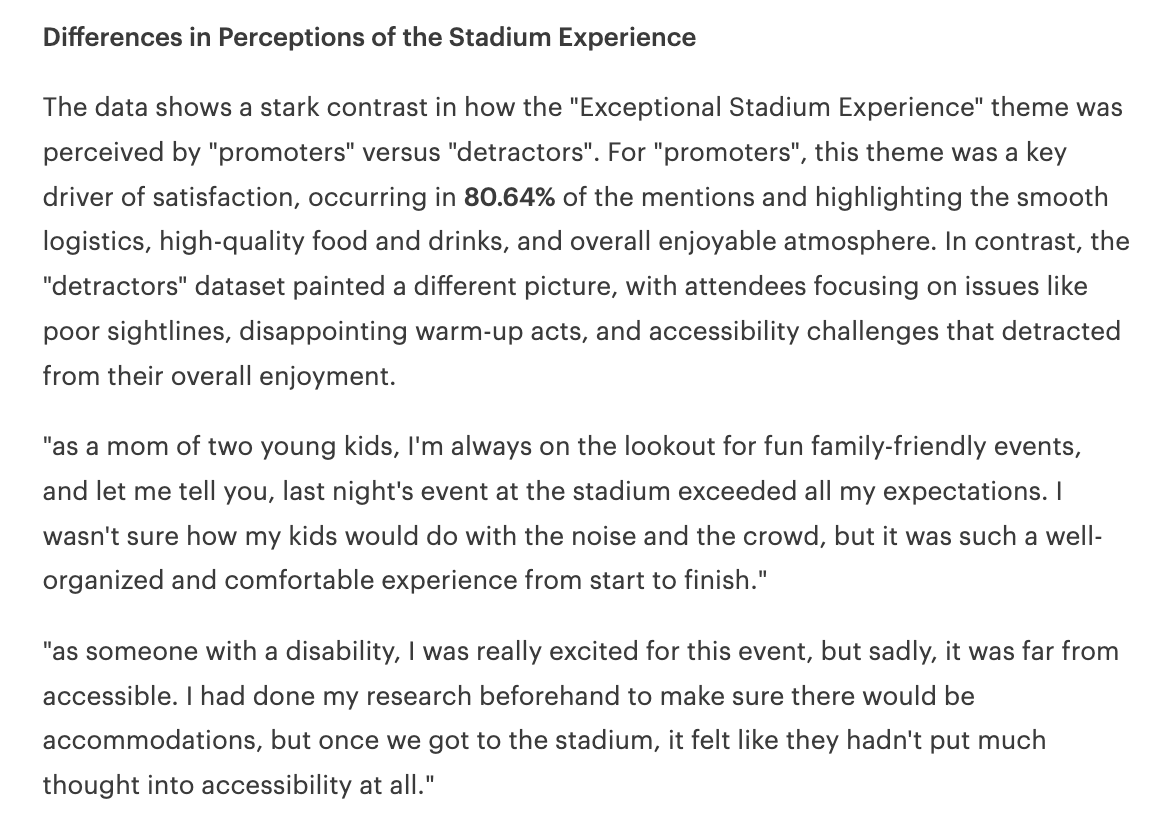
We don’t just pick random verbatims, either. Accelerator AI selectively identifies the exact verbatims that capture a broad range of fan experiences, while staying closely aligned with the key points identified. Even at this early stage, you can trust that the report fully contextualizes your data.
Dissecting the Accelerator AI report
We then proceed to the Dataset Breakdown. This is where you can see the granular detail which helps your reports give you the information you need to target exactly what matters at the right time.
We combine the topical classification from the Relative Language Model, with co-occurrence modeling and our metric calculations to identify the three top themes which exist on one side of your data.
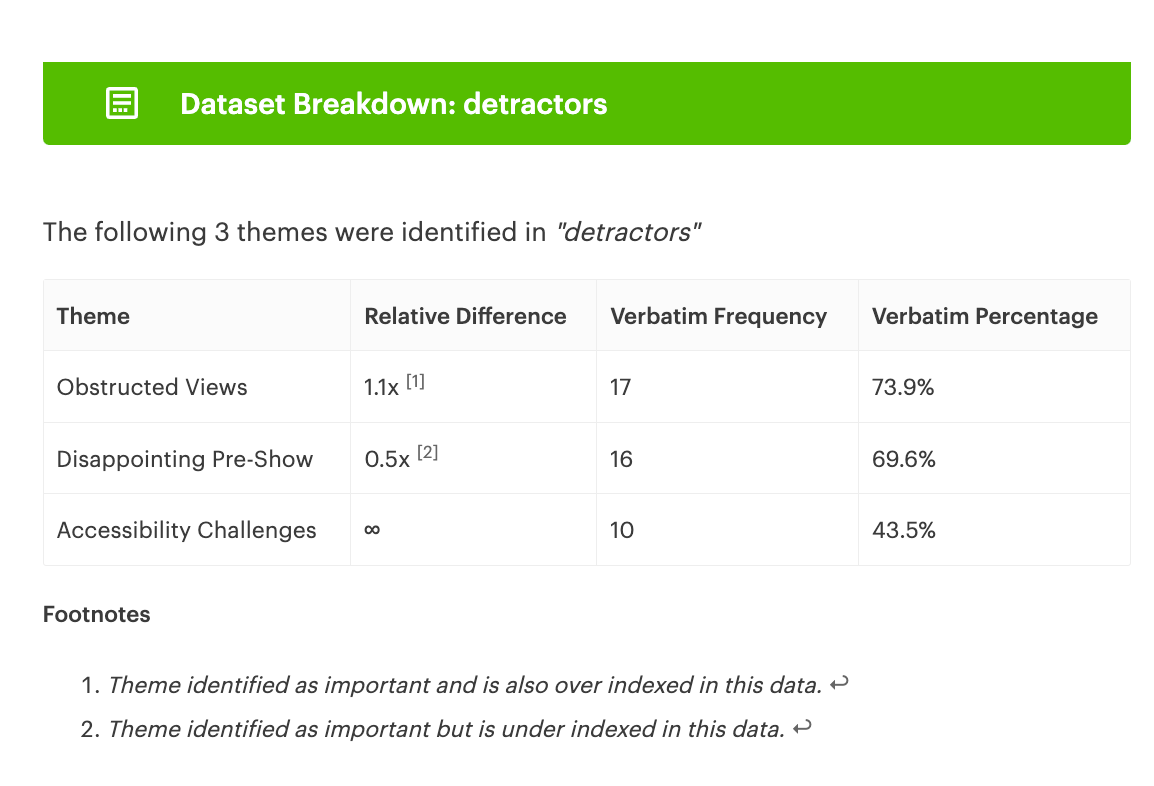
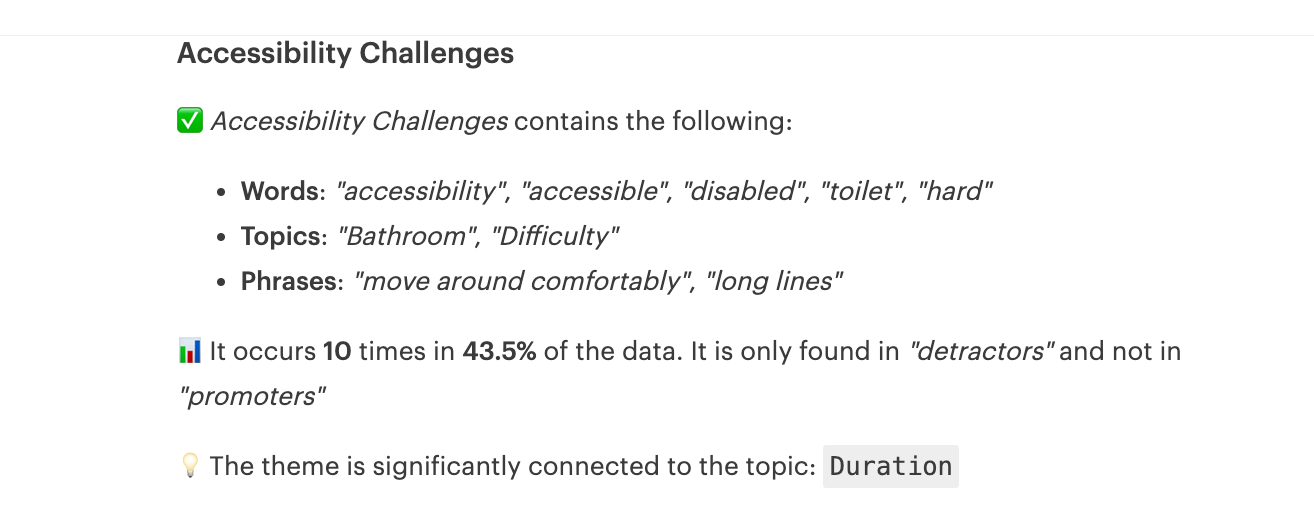
Here we can see the things which really made my fans dislike their time at the show
You can see that the Theme of “Accessibility Challenges” also exists in the platform within Explore. So if you want to dive deeper into this information, or audit the source – you can do that.
Each of the elements that you see in the initial table then gets a more detailed breakdown:
You can see the elements in the theme that are relevant as well as other linguistic connections and a review of the key metrics.
Getting the right context
The key element that has enabled this level of analysis sophistication is a technique called Retrieval-Augmented Generation. This change enabled language models to become more contextually sensitive – without needing to train or fine-tune on private data.
It means that we’re able to provide the right level of granularity and key metrics from our proprietary analyses, such as:
- Co-occurrences which link related elements of language
- Statistically significant themes
- Context-relevant topics
- Varied and specific verbatims.
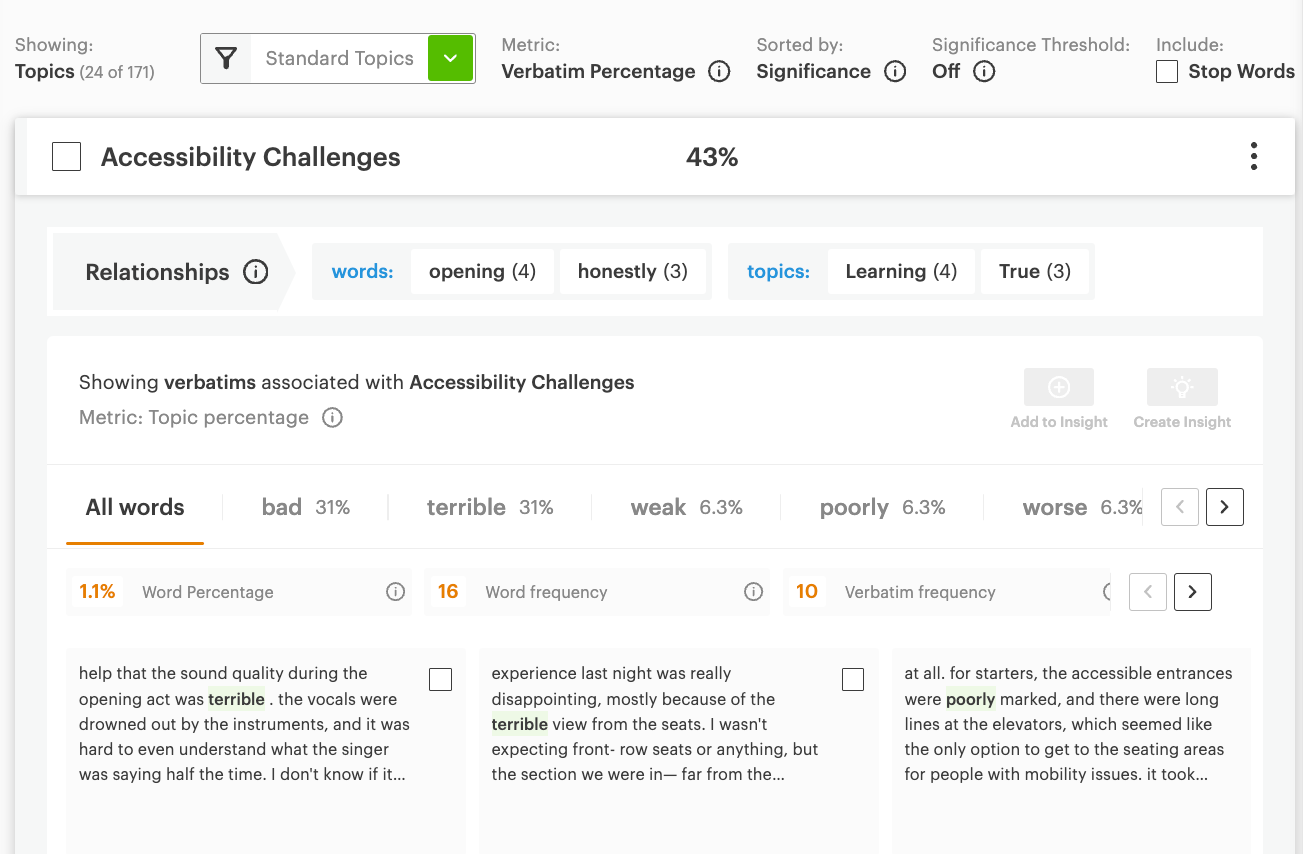
To see the value, let’s look at the granular breakdown of the theme of Accessibility Challenges. For each section, I have highlighted the content which goes into the LLM to provide this breakdown on the left-hand side.
| First, we pass in the topics and themes we’ve identified, as well as an informed selection of the relevant verbatims. By providing an overall summary of this content, we help empower the insights analyst who would otherwise have to manually write the report. The platform still allows for all of these facts to be checked, validated and investigated if you desire. We’re not a black box! | Accessibility Challenges Highlight Significant Barriers for Attendees with Disabilities The data highlights significant accessibility issues for attendees with disabilities, particularly around navigating the venue and accessing basic facilities like bathrooms. Examples describe the difficulties finding designated areas, long waits, and poor conditions that created frustration and a sense of exclusion. This theme indicates that event organizers must prioritize inclusive design and accommodations to ensure all attendees can fully participate and enjoy the experience. Accessibility Challenges Absent from “Promoters” Dataset The theme of “Accessibility Challenges” was found to only occur in the “detractors” dataset, and not at all in the “promoters” dataset. This suggests that the accessibility issues described were significant pain points for a subset of attendees, but not a concern raised by those who had an overall positive experience. The connection with “Duration” indicates that these pains were longstanding and experienced over a period of time. Consistent Concerns Around Accessibility and Cleanliness The quotes from “detractors” consistently highlight two key issues within the “Accessibility Challenges” theme: 1) difficulty navigating the venue and finding designated accessible areas, and 2) poor conditions and lack of cleanliness in the accessible bathrooms. These concerns were echoed across multiple attendee accounts, indicating they were widespread problems at the event. Actionable Steps Needed to Improve Accessibility The data makes it clear that event organizers must take concrete steps to address the accessibility challenges faced by attendees with disabilities. This includes better signage and wayfinding, more staff assistance, and a greater focus on maintaining clean and functional accessible facilities. Prioritizing inclusive design and accommodations will be crucial to ensuring all attendees can fully engage with and enjoy the event experience. |
| Here we identify how much the theme is used in the “promoters” data. In this case, we can see it doesn’t occur at all. These key metrics create trust in the findings. Again, we can see that they’re not just hallucinations. The absence of the theme in the promoters set is shown above, with the infinity sign in the table above, and on Explore. We can also see the use of the co-occurrence of Duration to further inform how this issue impacts the customer base. | |
| Here we can see the detractor verbatims are consistent in their complaints. We can also see the clusters which show the common theming in the verbatims. The fact that we can be confident that these issues are pervasive means we have an actionable insight to change these elements before the next show. | |
| And finally we see a suggested course of next steps to follow. This represents the output of all of the analysis and information processing which has gone on behind the scenes The turnaround from initially uploading the data is around 5 minutes (including reading time!) |
What does that mean for you?
So, what are the conclusions from this deep dive?
Well, for one, you can see the potential of Accelerator AI. We’re excited about the opportunity it provides, as it transforms how quickly you can find actionable insights from your data.
You can gain granular knowledge in your specific areas of interest and validate that information across the platform. This empowers your team to quickly get the right information to the right people. At the same time, you will keep the agency to make informed decisions based on the insights we provide. This approach helps drive your business forward without relying on a mysterious “black box” that cannot be audited or fully understood.