What does text analytics software do?

Text analytics companies develop software solutions that enable analysts and researchers to find better insights in qualitative text data. These tools allow insight teams to analyze this data in a fraction of the time it takes to do so manually and without the bias that is inherent to human-led approaches. In this sense, text analytics allows you to bring a big data approach to unstructured text in a way that other BI tools can’t.
There are many practical applications of text mining ranging from customer insights to market research, employee satisfaction and many more.
In this article, we’ll take a dive deep to answer the question: what does text analytics software do?
Analyze free text data at scale
Unlike you and your colleagues, text analytics tools don’t have other priorities to tend to. Whether you want to analyze 10,000 or 10,000,000 words the software will efficiently read through the data and provide an objective breakdown of what people are saying.
Automating the analysis of text data delivers two key benefits.
First is the time and cost savings associated with the elimination of manual analysis. By taking the human labor out of reading large amounts of data, your insight team can work more efficiently and focus their time on data storytelling.
Secondly, by removing the time and cost constraints to analyzing text-based data sources, text analysis provides a good solution for incorporating text data sources (that are too often neglected) into business intelligence processes.
Pinpoint what matters most in your data
Text analytics works by breaking down (parsing) a body of text into smaller parts based on a set of rules coded into natural language processing algorithms. Doing this allows text analysis tools to understand and reliably report on the contents and context of the text data being analyzed. This typically involves reporting on the topics, words, phrases and emotions most present in the data.
Some tools (including Relative Insight) also offer users the ability to compare relevant data sets to quickly identify differences and similarities. For example, many of our customers are comparing survey responses from high and low-value customers. Doing so may very quickly tell you that low-value customers are more likely to use the words ‘sale’ or ‘discount’ whereas high-value customers talk more about the ‘product range’.
Many text analysis solutions will also report on the emotions being expressed in analyzed messages. This will help you dive deeper into the minds of consumers than is possible with more rudimentary sentiment analysis tools that attempt to oversimplify emotion using a positive-neutral-negative scale that rarely generates useful insights.
Visualize key trends in text data
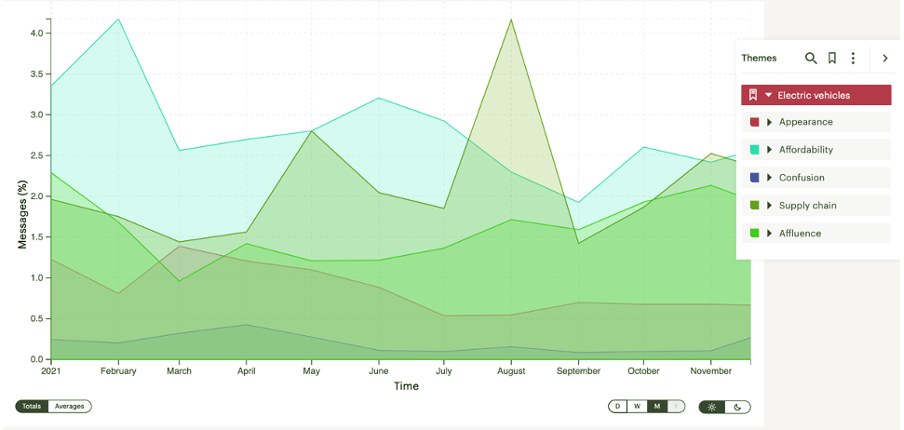
The backbone of any good BI tool is a range of visualizations that will help you understand what is happening in your data at a glance. Text analysis tools are no different. A typical example of a text analysis visualization is a time-series chart displaying changes in the prevalence of different topics in your data over time like the one shown above.
Consider if you worked for a retailer and saw the proportion of conversations mentioning delivery issues increasing month over month. A chart like the one shown would quickly alert you to the issue so you can inform your stakeholders and take swift action to buck concerning trends before they become full-blown issues.
What does text analytics software do? Now that you know the answer, are you thinking about investing in a text analytics solution? Download our text analysis guide or book a discovery call to get your questions answered by one of our experts!