The power of comparative text analysis: Building comparisons

Relative Insight’s platform uses comparative text analysis to reveal the important differences and similarities between your data sets.
A project in Relative Insight is broken down into five stages, and you define your business question(s) early in the process. Each question corresponds to a specific comparison, with a unique set of data.
Types of comparisons
You will often be able to use associated metadata points identified by our comparative text analytics software (e.g. demographic details of survey respondents) to split out a master data file. This will allow you to build multiple comparisons using the same data, giving you a 360° view of your audience.
However, sometimes you may need to source unique data sets for each side of the comparison, depending on what insights you are trying to derive.
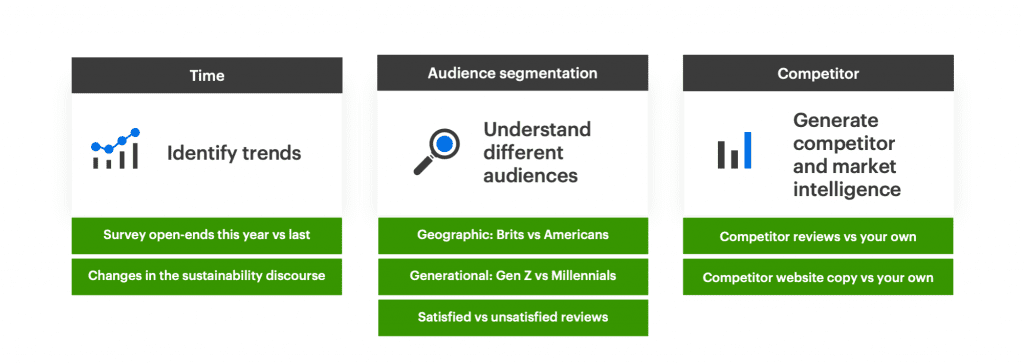
Some common types of analysis that use various attributes include topics and themes, audience, demographic, time, and geography.
Refining your questions
The more specific the question, the easier it is to determine how to gather or split data to build comparisons and get your insights. For example, Relative Insight can help you answer questions such as:
- How do people talk about my brand in the US and the UK?
- How has my recent ad campaign influenced discourse about my brand?
- How do people talk about soccer compared to baseball?
Relative Insight is an exploratory tool, so even with a broad business question, our comparative methodology can help you to identify what type of analysis is most beneficial.
For example, you want to understand how people talk about environmental issues. You have defined your business question and sourced some social listening data that you want to analyze. So, how do you get started?
Perform a time-based comparison
Time-based comparisons can help you understand the public discourse and the direction of conversation on a particular topic.
Example: If you split your social data by the date of posts, you might discover that two years ago people talked a lot about “recycling,” whereas now the focus is on “zero-waste.”
Choose the best data points
If your dataset has associated metadata, such as location, you can easily slice and dice it in the Data Library. This approach enables you to maximize the value you get from a single data source.
Example: If you split your data by location, you might discover that the discussion around “fossil fuels” remains prevalent in North America. On the other hand, in Europe, the conversation around “renewable energy” is picking up momentum.
Compare to standard English
If your previous steps didn’t yield any interesting results, you can also compare your dataset to the platform’s standard English model to surface key topics, phrases, and words in your data.
Example: Comparing to standard English can reveal a disproportionate tendency to use collective pronouns such as ‘we’ and ‘us.’
Define additional questions and split your data
Once you have built some comparisons and are more familiar with a dataset, you will start noticing key trends.
At this stage, you can define more specific questions and start to uncover the insights you are looking for.
Even some of the most unusual text data can help you to uncover interesting insight.
You can get insights using comparative text analysis from all kinds of surprising data sources. Check out our latest report, Making sense of the nonsensical: Analyzing the psychedelic language of trips for more inspiration. Or, get in touch with your account team to discuss what kind of comparisons you can make.